Creek vs Scandinavian Vision Disability
COMPARE
Creek
Scandinavian
Vision Disability
Vision Disability Comparison
Creek
Scandinavians
3.2%
VISION DISABILITY
0.0/ 100
METRIC RATING
340th/ 347
METRIC RANK
2.2%
VISION DISABILITY
50.0/ 100
METRIC RATING
173rd/ 347
METRIC RANK
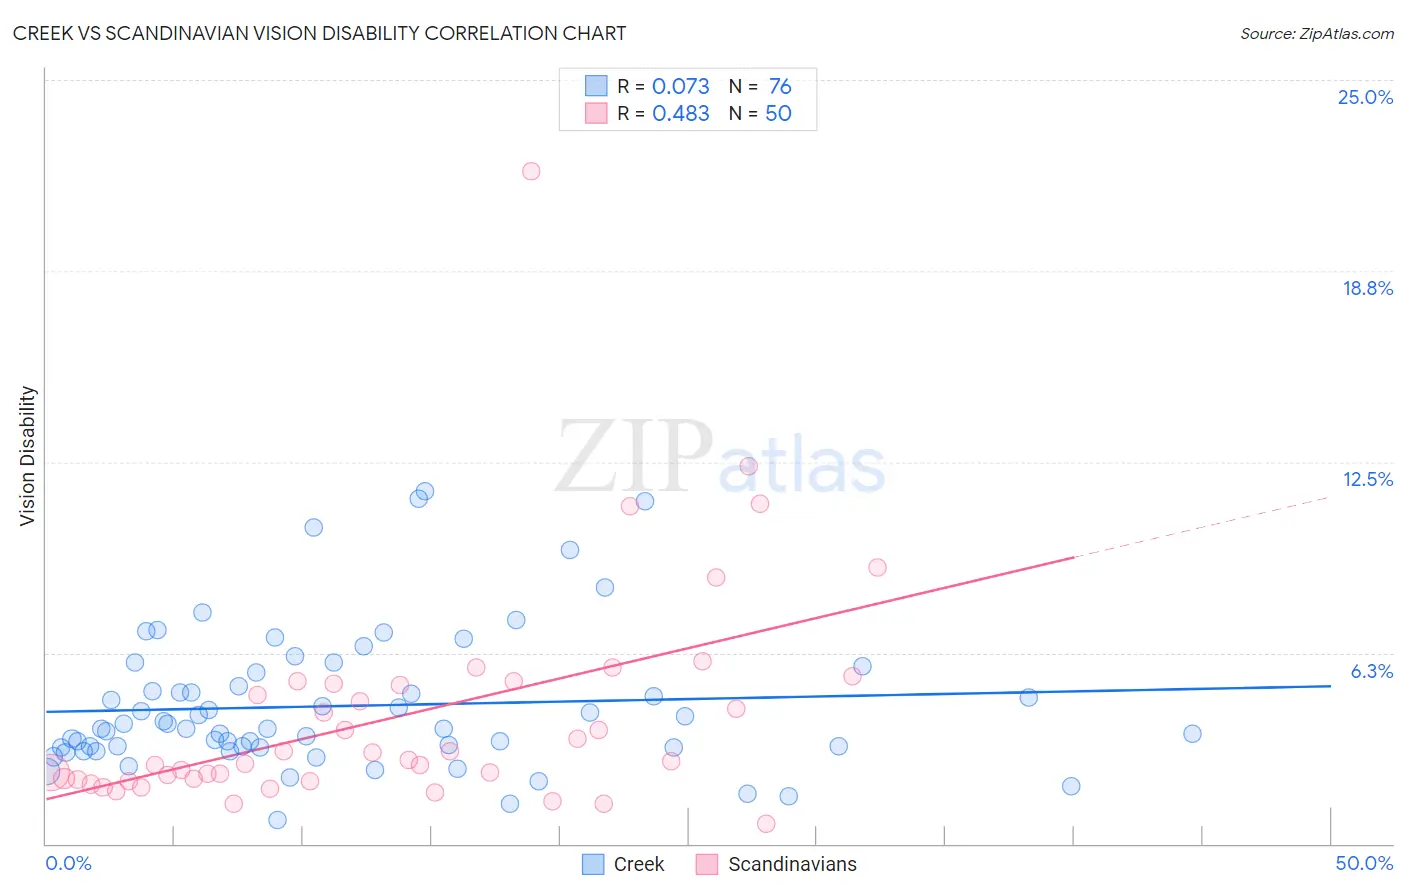
Creek vs Scandinavian Vision Disability Correlation Chart
The statistical analysis conducted on geographies consisting of 178,415,520 people shows a slight positive correlation between the proportion of Creek and percentage of population with vision disability in the United States with a correlation coefficient (R) of 0.073 and weighted average of 3.2%. Similarly, the statistical analysis conducted on geographies consisting of 471,900,698 people shows a moderate positive correlation between the proportion of Scandinavians and percentage of population with vision disability in the United States with a correlation coefficient (R) of 0.483 and weighted average of 2.2%, a difference of 48.0%.
Vision Disability Correlation Summary
| Measurement | Creek | Scandinavian |
| Minimum | 0.78% | 0.66% |
| Maximum | 11.5% | 22.0% |
| Range | 10.8% | 21.3% |
| Mean | 4.5% | 4.2% |
| Median | 3.8% | 2.7% |
| Interquartile 25% (IQ1) | 3.2% | 2.1% |
| Interquartile 75% (IQ3) | 5.4% | 5.2% |
| Interquartile Range (IQR) | 2.2% | 3.1% |
| Standard Deviation (Sample) | 2.3% | 3.7% |
| Standard Deviation (Population) | 2.3% | 3.7% |
Similar Demographics by Vision Disability
Demographics Similar to Creek by Vision Disability
In terms of vision disability, the demographic groups most similar to Creek are Tsimshian (3.2%, a difference of 0.13%), Chickasaw (3.2%, a difference of 0.82%), Kiowa (3.3%, a difference of 1.4%), Dutch West Indian (3.2%, a difference of 1.7%), and Alaskan Athabascan (3.1%, a difference of 1.8%).
| Demographics | Rating | Rank | Vision Disability |
| Cajuns | 0.0 /100 | #333 | Tragic 3.1% |
| Cheyenne | 0.0 /100 | #334 | Tragic 3.1% |
| Navajo | 0.0 /100 | #335 | Tragic 3.1% |
| Alaskan Athabascans | 0.0 /100 | #336 | Tragic 3.1% |
| Dutch West Indians | 0.0 /100 | #337 | Tragic 3.2% |
| Chickasaw | 0.0 /100 | #338 | Tragic 3.2% |
| Tsimshian | 0.0 /100 | #339 | Tragic 3.2% |
| Creek | 0.0 /100 | #340 | Tragic 3.2% |
| Kiowa | 0.0 /100 | #341 | Tragic 3.3% |
| Choctaw | 0.0 /100 | #342 | Tragic 3.3% |
| Pima | 0.0 /100 | #343 | Tragic 3.3% |
| Pueblo | 0.0 /100 | #344 | Tragic 3.3% |
| Lumbee | 0.0 /100 | #345 | Tragic 3.4% |
| Houma | 0.0 /100 | #346 | Tragic 3.4% |
| Puerto Ricans | 0.0 /100 | #347 | Tragic 3.9% |
Demographics Similar to Scandinavians by Vision Disability
In terms of vision disability, the demographic groups most similar to Scandinavians are Northern European (2.2%, a difference of 0.0%), Immigrants from Canada (2.2%, a difference of 0.0%), Immigrants from Fiji (2.2%, a difference of 0.15%), Yugoslavian (2.2%, a difference of 0.22%), and Slavic (2.2%, a difference of 0.26%).
| Demographics | Rating | Rank | Vision Disability |
| Immigrants | England | 62.8 /100 | #166 | Good 2.1% |
| Immigrants | Africa | 62.6 /100 | #167 | Good 2.1% |
| Brazilians | 62.2 /100 | #168 | Good 2.1% |
| South American Indians | 57.4 /100 | #169 | Average 2.2% |
| Swiss | 55.7 /100 | #170 | Average 2.2% |
| Lebanese | 54.3 /100 | #171 | Average 2.2% |
| Northern Europeans | 50.1 /100 | #172 | Average 2.2% |
| Scandinavians | 50.0 /100 | #173 | Average 2.2% |
| Immigrants | Canada | 50.0 /100 | #174 | Average 2.2% |
| Immigrants | Fiji | 47.6 /100 | #175 | Average 2.2% |
| Yugoslavians | 46.5 /100 | #176 | Average 2.2% |
| Slavs | 46.0 /100 | #177 | Average 2.2% |
| Immigrants | Oceania | 45.1 /100 | #178 | Average 2.2% |
| Immigrants | North America | 44.5 /100 | #179 | Average 2.2% |
| Uruguayans | 42.7 /100 | #180 | Average 2.2% |