Malaysian vs Immigrants from Japan Married-couple Households
COMPARE
Malaysian
Immigrants from Japan
Married-couple Households
Married-couple Households Comparison
Malaysians
Immigrants from Japan
46.3%
MARRIED-COUPLE HOUSEHOLDS
41.8/ 100
METRIC RATING
181st/ 347
METRIC RANK
47.7%
MARRIED-COUPLE HOUSEHOLDS
94.4/ 100
METRIC RATING
108th/ 347
METRIC RANK
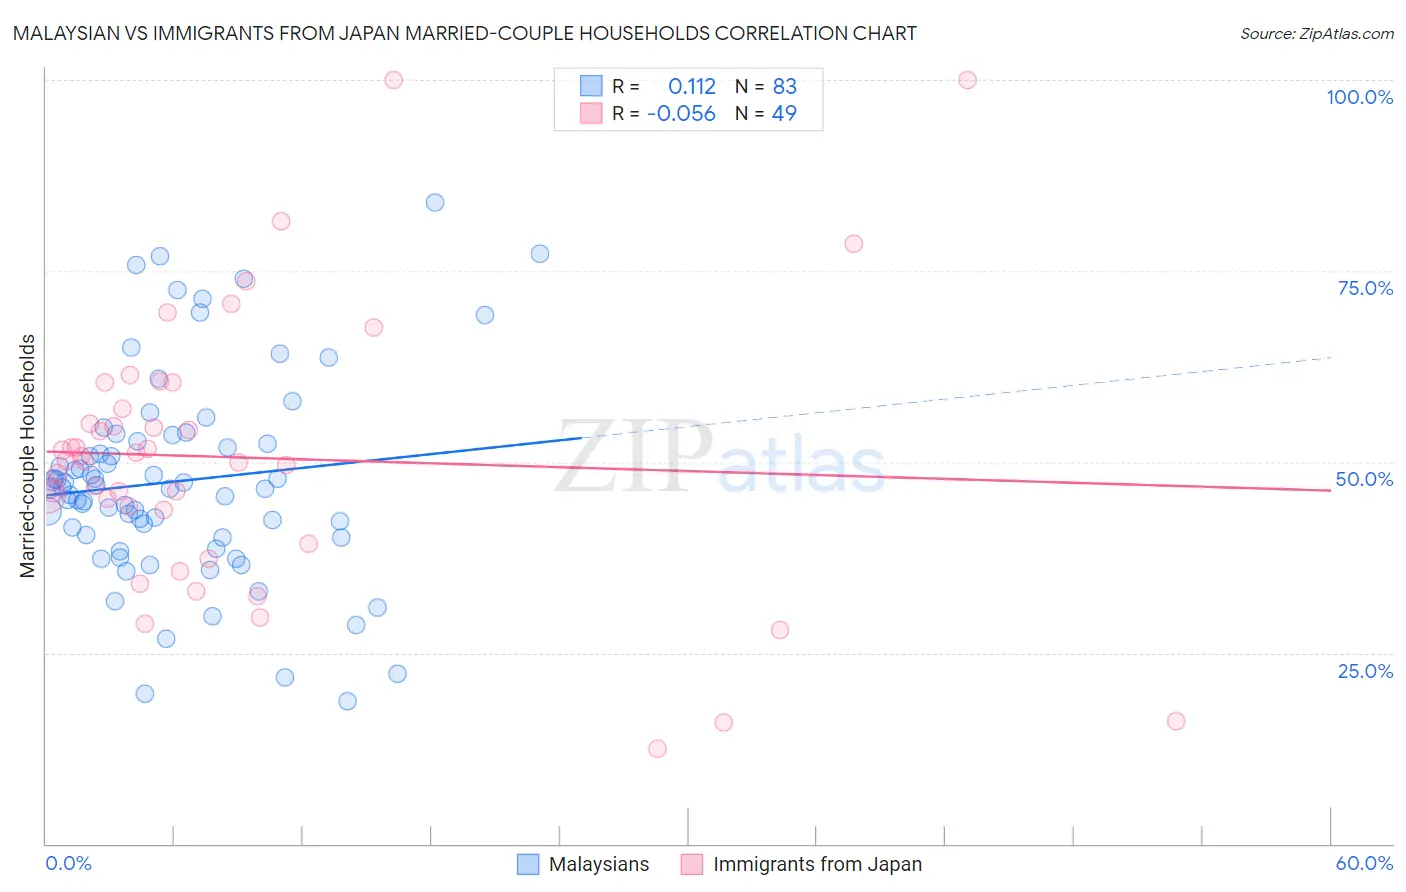
Malaysian vs Immigrants from Japan Married-couple Households Correlation Chart
The statistical analysis conducted on geographies consisting of 226,006,670 people shows a poor positive correlation between the proportion of Malaysians and percentage of married-couple family households in the United States with a correlation coefficient (R) of 0.112 and weighted average of 46.3%. Similarly, the statistical analysis conducted on geographies consisting of 339,976,257 people shows a slight negative correlation between the proportion of Immigrants from Japan and percentage of married-couple family households in the United States with a correlation coefficient (R) of -0.056 and weighted average of 47.7%, a difference of 3.0%.
Married-couple Households Correlation Summary
| Measurement | Malaysian | Immigrants from Japan |
| Minimum | 18.6% | 12.5% |
| Maximum | 84.0% | 100.0% |
| Range | 65.4% | 87.5% |
| Mean | 47.5% | 50.6% |
| Median | 46.5% | 50.2% |
| Interquartile 25% (IQ1) | 40.1% | 41.5% |
| Interquartile 75% (IQ3) | 52.7% | 58.7% |
| Interquartile Range (IQR) | 12.6% | 17.2% |
| Standard Deviation (Sample) | 13.3% | 18.1% |
| Standard Deviation (Population) | 13.2% | 17.9% |
Similar Demographics by Married-couple Households
Demographics Similar to Malaysians by Married-couple Households
In terms of married-couple households, the demographic groups most similar to Malaysians are Mongolian (46.3%, a difference of 0.010%), Immigrants from Zimbabwe (46.3%, a difference of 0.050%), Immigrants from Costa Rica (46.3%, a difference of 0.060%), Immigrants (46.3%, a difference of 0.080%), and Yugoslavian (46.2%, a difference of 0.12%).
| Demographics | Rating | Rank | Married-couple Households |
| Immigrants | Mexico | 50.0 /100 | #174 | Average 46.4% |
| Immigrants | Colombia | 46.1 /100 | #175 | Average 46.4% |
| Cajuns | 45.2 /100 | #176 | Average 46.4% |
| Immigrants | Immigrants | 43.8 /100 | #177 | Average 46.3% |
| Immigrants | Costa Rica | 43.4 /100 | #178 | Average 46.3% |
| Immigrants | Zimbabwe | 43.0 /100 | #179 | Average 46.3% |
| Mongolians | 42.0 /100 | #180 | Average 46.3% |
| Malaysians | 41.8 /100 | #181 | Average 46.3% |
| Yugoslavians | 38.9 /100 | #182 | Fair 46.2% |
| Immigrants | Brazil | 38.3 /100 | #183 | Fair 46.2% |
| Immigrants | Switzerland | 36.9 /100 | #184 | Fair 46.2% |
| Brazilians | 35.9 /100 | #185 | Fair 46.2% |
| Albanians | 31.1 /100 | #186 | Fair 46.1% |
| Fijians | 29.2 /100 | #187 | Fair 46.1% |
| South American Indians | 28.4 /100 | #188 | Fair 46.0% |
Demographics Similar to Immigrants from Japan by Married-couple Households
In terms of married-couple households, the demographic groups most similar to Immigrants from Japan are Estonian (47.7%, a difference of 0.050%), Immigrants from Jordan (47.7%, a difference of 0.050%), Macedonian (47.6%, a difference of 0.070%), Syrian (47.6%, a difference of 0.080%), and Peruvian (47.6%, a difference of 0.090%).
| Demographics | Rating | Rank | Married-couple Households |
| Turks | 96.1 /100 | #101 | Exceptional 47.8% |
| Slavs | 96.0 /100 | #102 | Exceptional 47.8% |
| Hawaiians | 96.0 /100 | #103 | Exceptional 47.8% |
| Immigrants | South Africa | 96.0 /100 | #104 | Exceptional 47.8% |
| Immigrants | Czechoslovakia | 95.5 /100 | #105 | Exceptional 47.8% |
| Portuguese | 95.5 /100 | #106 | Exceptional 47.8% |
| Estonians | 94.7 /100 | #107 | Exceptional 47.7% |
| Immigrants | Japan | 94.4 /100 | #108 | Exceptional 47.7% |
| Immigrants | Jordan | 94.1 /100 | #109 | Exceptional 47.7% |
| Macedonians | 93.9 /100 | #110 | Exceptional 47.6% |
| Syrians | 93.9 /100 | #111 | Exceptional 47.6% |
| Peruvians | 93.8 /100 | #112 | Exceptional 47.6% |
| Venezuelans | 93.8 /100 | #113 | Exceptional 47.6% |
| Immigrants | Europe | 93.7 /100 | #114 | Exceptional 47.6% |
| Slovaks | 92.9 /100 | #115 | Exceptional 47.6% |