Potawatomi vs Immigrants from Spain Female Disability
COMPARE
Potawatomi
Immigrants from Spain
Female Disability
Female Disability Comparison
Potawatomi
Immigrants from Spain
14.1%
FEMALE DISABILITY
0.0/ 100
METRIC RATING
321st/ 347
METRIC RANK
11.4%
FEMALE DISABILITY
99.9/ 100
METRIC RATING
59th/ 347
METRIC RANK
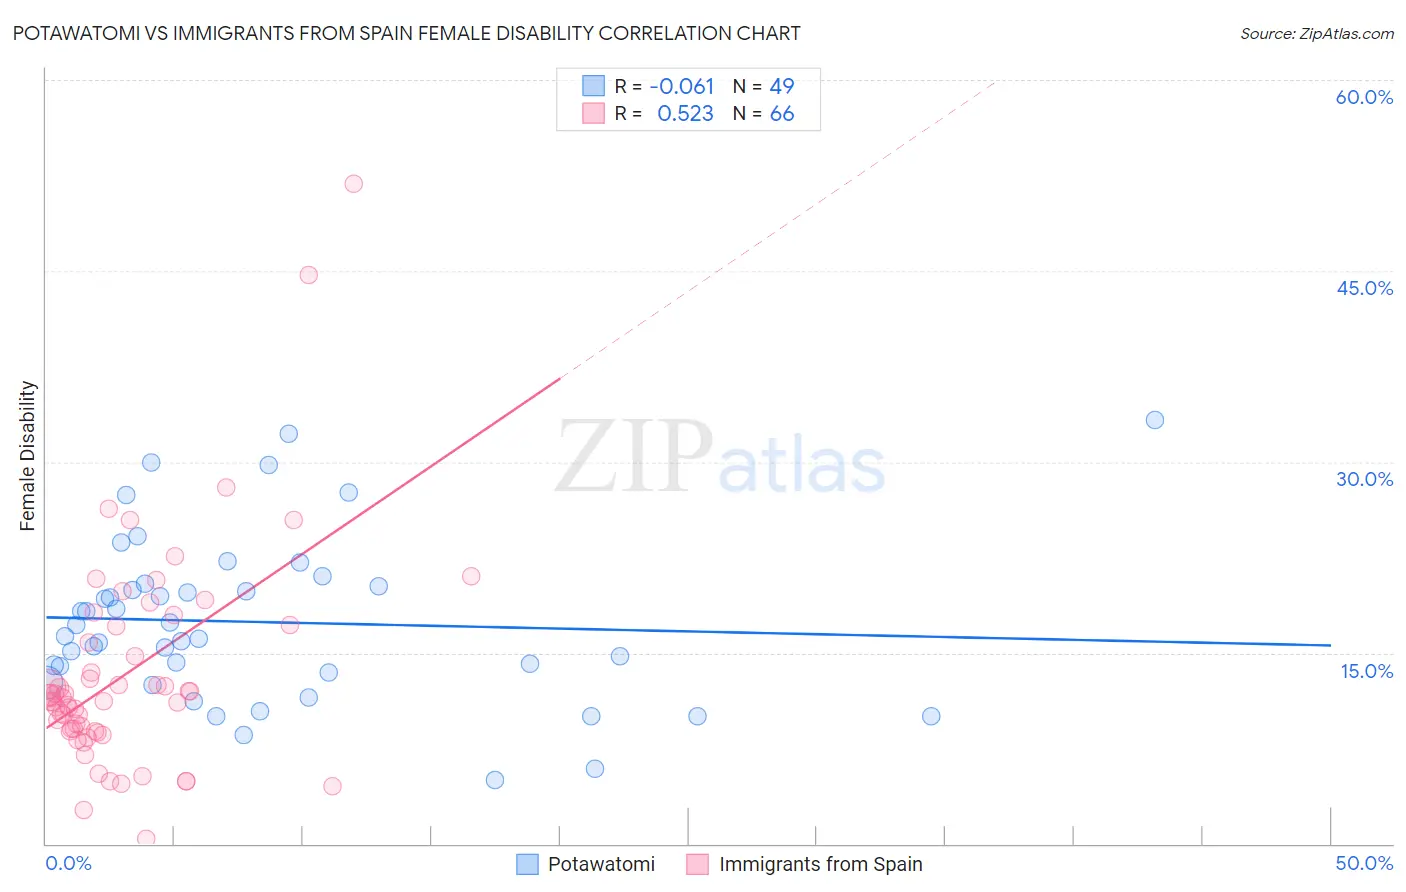
Potawatomi vs Immigrants from Spain Female Disability Correlation Chart
The statistical analysis conducted on geographies consisting of 117,767,381 people shows a slight negative correlation between the proportion of Potawatomi and percentage of females with a disability in the United States with a correlation coefficient (R) of -0.061 and weighted average of 14.1%. Similarly, the statistical analysis conducted on geographies consisting of 239,683,022 people shows a substantial positive correlation between the proportion of Immigrants from Spain and percentage of females with a disability in the United States with a correlation coefficient (R) of 0.523 and weighted average of 11.4%, a difference of 23.9%.
Female Disability Correlation Summary
| Measurement | Potawatomi | Immigrants from Spain |
| Minimum | 5.0% | 0.40% |
| Maximum | 33.3% | 51.8% |
| Range | 28.3% | 51.4% |
| Mean | 17.4% | 13.4% |
| Median | 16.3% | 11.4% |
| Interquartile 25% (IQ1) | 13.0% | 8.8% |
| Interquartile 75% (IQ3) | 20.3% | 17.1% |
| Interquartile Range (IQR) | 7.3% | 8.2% |
| Standard Deviation (Sample) | 6.5% | 8.5% |
| Standard Deviation (Population) | 6.4% | 8.5% |
Similar Demographics by Female Disability
Demographics Similar to Potawatomi by Female Disability
In terms of female disability, the demographic groups most similar to Potawatomi are Pueblo (14.1%, a difference of 0.010%), American (14.1%, a difference of 0.14%), Black/African American (14.1%, a difference of 0.18%), Native/Alaskan (14.1%, a difference of 0.20%), and Navajo (14.2%, a difference of 0.33%).
| Demographics | Rating | Rank | Female Disability |
| Puget Sound Salish | 0.0 /100 | #314 | Tragic 13.8% |
| Alaskan Athabascans | 0.0 /100 | #315 | Tragic 13.9% |
| Spanish Americans | 0.0 /100 | #316 | Tragic 14.0% |
| Chippewa | 0.0 /100 | #317 | Tragic 14.0% |
| Paiute | 0.0 /100 | #318 | Tragic 14.0% |
| Iroquois | 0.0 /100 | #319 | Tragic 14.0% |
| Americans | 0.0 /100 | #320 | Tragic 14.1% |
| Potawatomi | 0.0 /100 | #321 | Tragic 14.1% |
| Pueblo | 0.0 /100 | #322 | Tragic 14.1% |
| Blacks/African Americans | 0.0 /100 | #323 | Tragic 14.1% |
| Natives/Alaskans | 0.0 /100 | #324 | Tragic 14.1% |
| Navajo | 0.0 /100 | #325 | Tragic 14.2% |
| Comanche | 0.0 /100 | #326 | Tragic 14.2% |
| Ottawa | 0.0 /100 | #327 | Tragic 14.2% |
| Cape Verdeans | 0.0 /100 | #328 | Tragic 14.2% |
Demographics Similar to Immigrants from Spain by Female Disability
In terms of female disability, the demographic groups most similar to Immigrants from Spain are Immigrants from Bulgaria (11.4%, a difference of 0.11%), Laotian (11.4%, a difference of 0.13%), South American (11.4%, a difference of 0.15%), Immigrants from France (11.4%, a difference of 0.17%), and Taiwanese (11.4%, a difference of 0.23%).
| Demographics | Rating | Rank | Female Disability |
| Immigrants | Peru | 99.9 /100 | #52 | Exceptional 11.3% |
| Immigrants | Saudi Arabia | 99.9 /100 | #53 | Exceptional 11.3% |
| Peruvians | 99.9 /100 | #54 | Exceptional 11.3% |
| Bulgarians | 99.9 /100 | #55 | Exceptional 11.3% |
| Taiwanese | 99.9 /100 | #56 | Exceptional 11.4% |
| South Americans | 99.9 /100 | #57 | Exceptional 11.4% |
| Laotians | 99.9 /100 | #58 | Exceptional 11.4% |
| Immigrants | Spain | 99.9 /100 | #59 | Exceptional 11.4% |
| Immigrants | Bulgaria | 99.9 /100 | #60 | Exceptional 11.4% |
| Immigrants | France | 99.9 /100 | #61 | Exceptional 11.4% |
| Sri Lankans | 99.9 /100 | #62 | Exceptional 11.4% |
| Immigrants | Colombia | 99.9 /100 | #63 | Exceptional 11.4% |
| Immigrants | El Salvador | 99.9 /100 | #64 | Exceptional 11.4% |
| Immigrants | South America | 99.9 /100 | #65 | Exceptional 11.4% |
| Salvadorans | 99.8 /100 | #66 | Exceptional 11.5% |