Immigrants from Canada vs Immigrants from Nepal Vision Disability
COMPARE
Immigrants from Canada
Immigrants from Nepal
Vision Disability
Vision Disability Comparison
Immigrants from Canada
Immigrants from Nepal
2.2%
VISION DISABILITY
50.0/ 100
METRIC RATING
174th/ 347
METRIC RANK
1.9%
VISION DISABILITY
99.9/ 100
METRIC RATING
30th/ 347
METRIC RANK
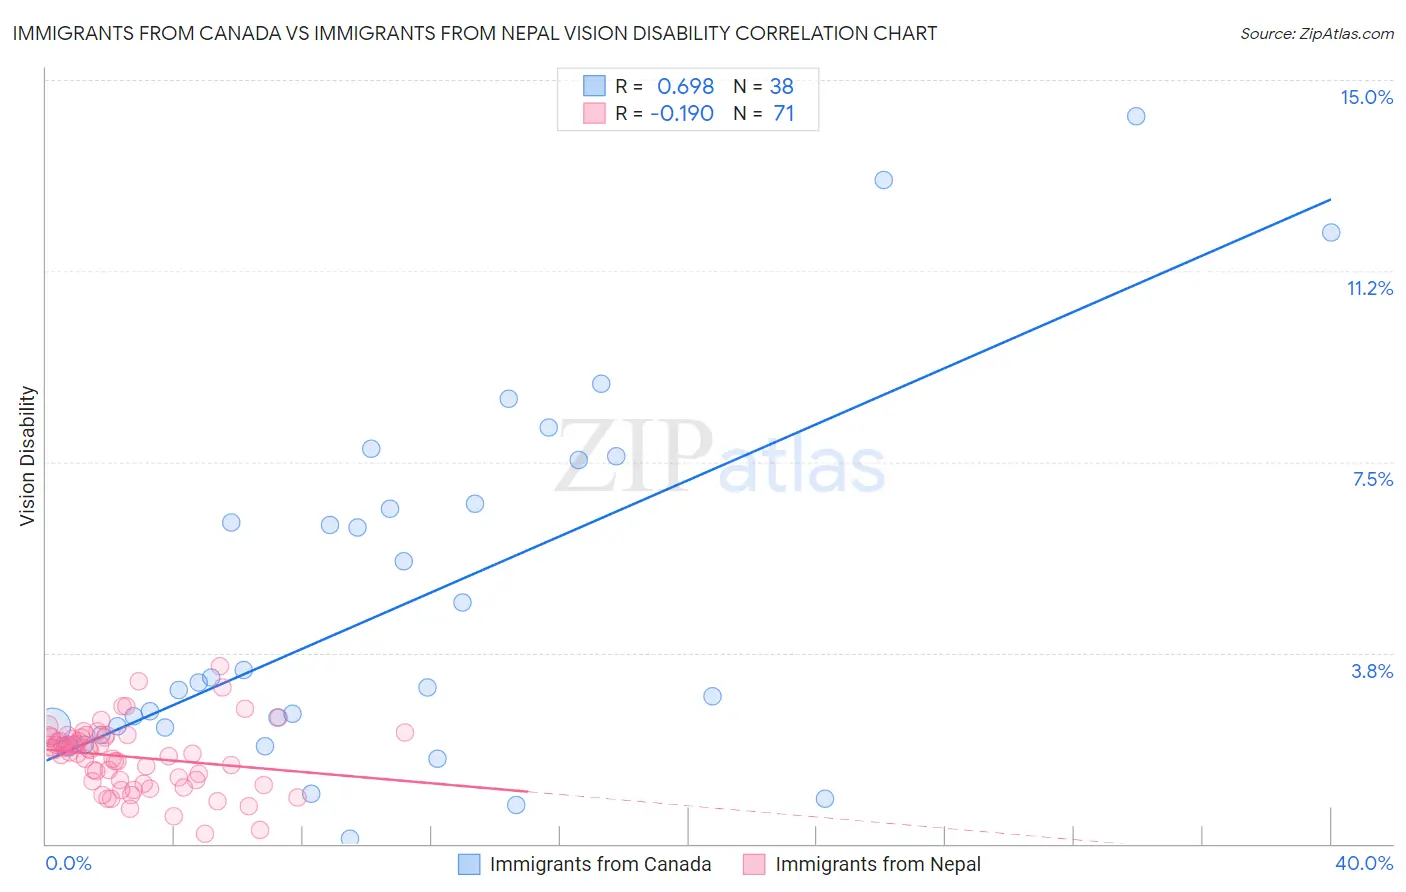
Immigrants from Canada vs Immigrants from Nepal Vision Disability Correlation Chart
The statistical analysis conducted on geographies consisting of 458,814,509 people shows a significant positive correlation between the proportion of Immigrants from Canada and percentage of population with vision disability in the United States with a correlation coefficient (R) of 0.698 and weighted average of 2.2%. Similarly, the statistical analysis conducted on geographies consisting of 186,747,403 people shows a poor negative correlation between the proportion of Immigrants from Nepal and percentage of population with vision disability in the United States with a correlation coefficient (R) of -0.190 and weighted average of 1.9%, a difference of 12.2%.
Vision Disability Correlation Summary
| Measurement | Immigrants from Canada | Immigrants from Nepal |
| Minimum | 0.10% | 0.19% |
| Maximum | 14.3% | 3.5% |
| Range | 14.2% | 3.3% |
| Mean | 4.7% | 1.7% |
| Median | 3.1% | 1.8% |
| Interquartile 25% (IQ1) | 2.3% | 1.2% |
| Interquartile 75% (IQ3) | 6.7% | 2.1% |
| Interquartile Range (IQR) | 4.4% | 0.87% |
| Standard Deviation (Sample) | 3.5% | 0.65% |
| Standard Deviation (Population) | 3.5% | 0.65% |
Similar Demographics by Vision Disability
Demographics Similar to Immigrants from Canada by Vision Disability
In terms of vision disability, the demographic groups most similar to Immigrants from Canada are Scandinavian (2.2%, a difference of 0.0%), Northern European (2.2%, a difference of 0.010%), Immigrants from Fiji (2.2%, a difference of 0.15%), Yugoslavian (2.2%, a difference of 0.22%), and Slavic (2.2%, a difference of 0.26%).
| Demographics | Rating | Rank | Vision Disability |
| Immigrants | Africa | 62.6 /100 | #167 | Good 2.1% |
| Brazilians | 62.2 /100 | #168 | Good 2.1% |
| South American Indians | 57.4 /100 | #169 | Average 2.2% |
| Swiss | 55.7 /100 | #170 | Average 2.2% |
| Lebanese | 54.3 /100 | #171 | Average 2.2% |
| Northern Europeans | 50.1 /100 | #172 | Average 2.2% |
| Scandinavians | 50.0 /100 | #173 | Average 2.2% |
| Immigrants | Canada | 50.0 /100 | #174 | Average 2.2% |
| Immigrants | Fiji | 47.6 /100 | #175 | Average 2.2% |
| Yugoslavians | 46.5 /100 | #176 | Average 2.2% |
| Slavs | 46.0 /100 | #177 | Average 2.2% |
| Immigrants | Oceania | 45.1 /100 | #178 | Average 2.2% |
| Immigrants | North America | 44.5 /100 | #179 | Average 2.2% |
| Uruguayans | 42.7 /100 | #180 | Average 2.2% |
| Immigrants | Western Europe | 41.1 /100 | #181 | Average 2.2% |
Demographics Similar to Immigrants from Nepal by Vision Disability
In terms of vision disability, the demographic groups most similar to Immigrants from Nepal are Egyptian (1.9%, a difference of 0.040%), Immigrants from Malaysia (1.9%, a difference of 0.11%), Taiwanese (1.9%, a difference of 0.13%), Mongolian (1.9%, a difference of 0.17%), and Luxembourger (1.9%, a difference of 0.43%).
| Demographics | Rating | Rank | Vision Disability |
| Immigrants | Asia | 99.9 /100 | #23 | Exceptional 1.9% |
| Immigrants | Lithuania | 99.9 /100 | #24 | Exceptional 1.9% |
| Bulgarians | 99.9 /100 | #25 | Exceptional 1.9% |
| Immigrants | Japan | 99.9 /100 | #26 | Exceptional 1.9% |
| Taiwanese | 99.9 /100 | #27 | Exceptional 1.9% |
| Immigrants | Malaysia | 99.9 /100 | #28 | Exceptional 1.9% |
| Egyptians | 99.9 /100 | #29 | Exceptional 1.9% |
| Immigrants | Nepal | 99.9 /100 | #30 | Exceptional 1.9% |
| Mongolians | 99.9 /100 | #31 | Exceptional 1.9% |
| Luxembourgers | 99.9 /100 | #32 | Exceptional 1.9% |
| Immigrants | Egypt | 99.9 /100 | #33 | Exceptional 1.9% |
| Immigrants | Turkey | 99.8 /100 | #34 | Exceptional 1.9% |
| Immigrants | Australia | 99.8 /100 | #35 | Exceptional 1.9% |
| Cambodians | 99.8 /100 | #36 | Exceptional 2.0% |
| Bhutanese | 99.8 /100 | #37 | Exceptional 2.0% |