Immigrants from El Salvador vs Immigrants from Nepal Vision Disability
COMPARE
Immigrants from El Salvador
Immigrants from Nepal
Vision Disability
Vision Disability Comparison
Immigrants from El Salvador
Immigrants from Nepal
2.2%
VISION DISABILITY
21.0/ 100
METRIC RATING
199th/ 347
METRIC RANK
1.9%
VISION DISABILITY
99.9/ 100
METRIC RATING
30th/ 347
METRIC RANK
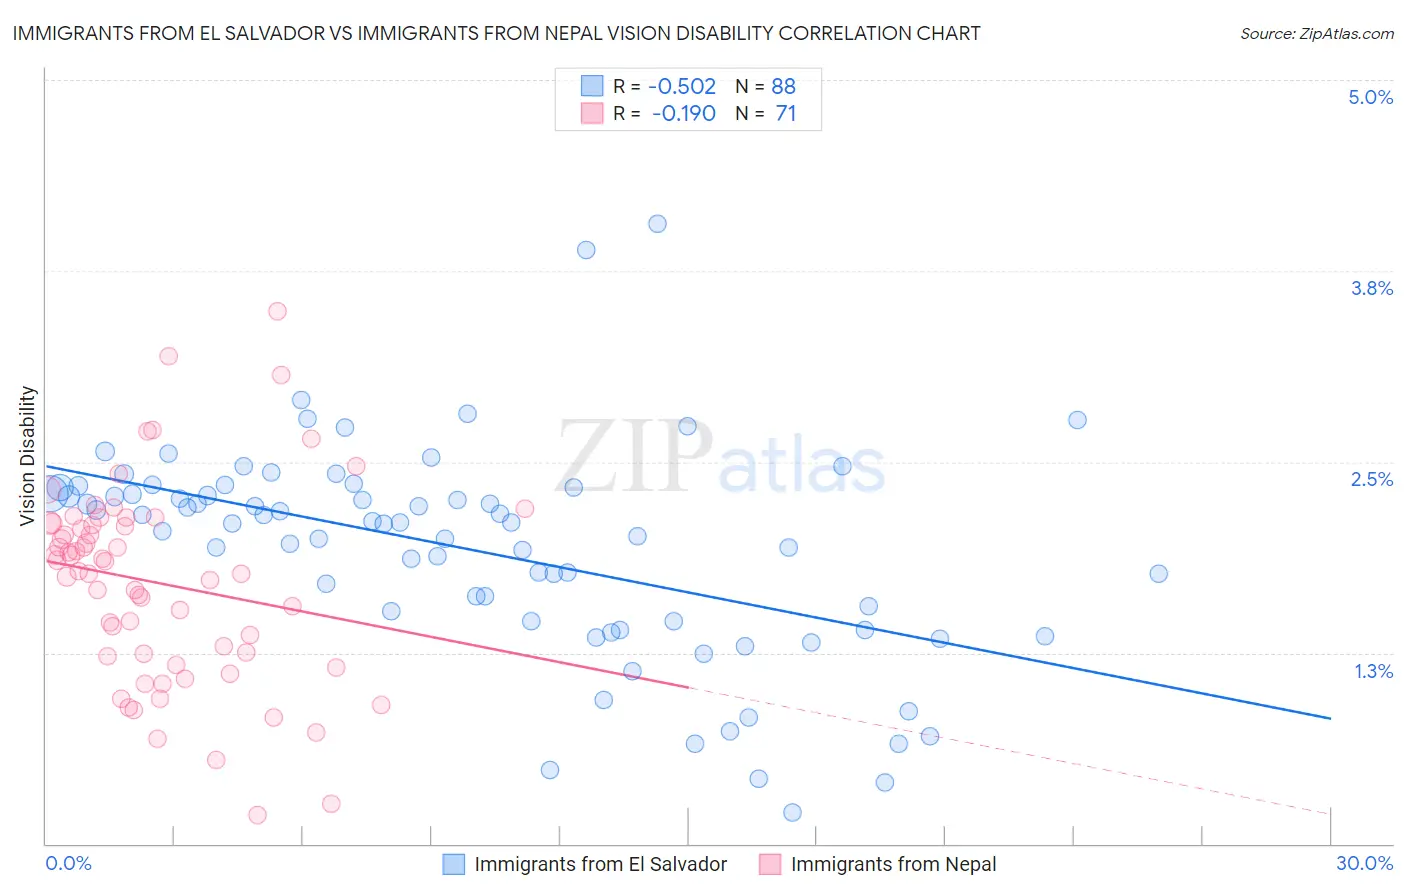
Immigrants from El Salvador vs Immigrants from Nepal Vision Disability Correlation Chart
The statistical analysis conducted on geographies consisting of 357,605,888 people shows a substantial negative correlation between the proportion of Immigrants from El Salvador and percentage of population with vision disability in the United States with a correlation coefficient (R) of -0.502 and weighted average of 2.2%. Similarly, the statistical analysis conducted on geographies consisting of 186,747,403 people shows a poor negative correlation between the proportion of Immigrants from Nepal and percentage of population with vision disability in the United States with a correlation coefficient (R) of -0.190 and weighted average of 1.9%, a difference of 14.6%.
Vision Disability Correlation Summary
| Measurement | Immigrants from El Salvador | Immigrants from Nepal |
| Minimum | 0.21% | 0.19% |
| Maximum | 4.1% | 3.5% |
| Range | 3.9% | 3.3% |
| Mean | 1.9% | 1.7% |
| Median | 2.1% | 1.8% |
| Interquartile 25% (IQ1) | 1.5% | 1.2% |
| Interquartile 75% (IQ3) | 2.3% | 2.1% |
| Interquartile Range (IQR) | 0.86% | 0.87% |
| Standard Deviation (Sample) | 0.70% | 0.65% |
| Standard Deviation (Population) | 0.69% | 0.65% |
Similar Demographics by Vision Disability
Demographics Similar to Immigrants from El Salvador by Vision Disability
In terms of vision disability, the demographic groups most similar to Immigrants from El Salvador are Czechoslovakian (2.2%, a difference of 0.050%), Ghanaian (2.2%, a difference of 0.070%), Immigrants from Thailand (2.2%, a difference of 0.090%), Immigrants from Grenada (2.2%, a difference of 0.18%), and Slovak (2.2%, a difference of 0.21%).
| Demographics | Rating | Rank | Vision Disability |
| Europeans | 25.7 /100 | #192 | Fair 2.2% |
| British | 25.1 /100 | #193 | Fair 2.2% |
| Immigrants | Barbados | 24.0 /100 | #194 | Fair 2.2% |
| Immigrants | Immigrants | 23.7 /100 | #195 | Fair 2.2% |
| Immigrants | Grenada | 23.1 /100 | #196 | Fair 2.2% |
| Ghanaians | 21.8 /100 | #197 | Fair 2.2% |
| Czechoslovakians | 21.6 /100 | #198 | Fair 2.2% |
| Immigrants | El Salvador | 21.0 /100 | #199 | Fair 2.2% |
| Immigrants | Thailand | 20.1 /100 | #200 | Fair 2.2% |
| Slovaks | 18.8 /100 | #201 | Poor 2.2% |
| Immigrants | Zaire | 18.0 /100 | #202 | Poor 2.2% |
| Dutch | 17.1 /100 | #203 | Poor 2.2% |
| Immigrants | Guyana | 15.9 /100 | #204 | Poor 2.2% |
| Samoans | 15.7 /100 | #205 | Poor 2.2% |
| Pennsylvania Germans | 14.5 /100 | #206 | Poor 2.2% |
Demographics Similar to Immigrants from Nepal by Vision Disability
In terms of vision disability, the demographic groups most similar to Immigrants from Nepal are Egyptian (1.9%, a difference of 0.040%), Immigrants from Malaysia (1.9%, a difference of 0.11%), Taiwanese (1.9%, a difference of 0.13%), Mongolian (1.9%, a difference of 0.17%), and Luxembourger (1.9%, a difference of 0.43%).
| Demographics | Rating | Rank | Vision Disability |
| Immigrants | Asia | 99.9 /100 | #23 | Exceptional 1.9% |
| Immigrants | Lithuania | 99.9 /100 | #24 | Exceptional 1.9% |
| Bulgarians | 99.9 /100 | #25 | Exceptional 1.9% |
| Immigrants | Japan | 99.9 /100 | #26 | Exceptional 1.9% |
| Taiwanese | 99.9 /100 | #27 | Exceptional 1.9% |
| Immigrants | Malaysia | 99.9 /100 | #28 | Exceptional 1.9% |
| Egyptians | 99.9 /100 | #29 | Exceptional 1.9% |
| Immigrants | Nepal | 99.9 /100 | #30 | Exceptional 1.9% |
| Mongolians | 99.9 /100 | #31 | Exceptional 1.9% |
| Luxembourgers | 99.9 /100 | #32 | Exceptional 1.9% |
| Immigrants | Egypt | 99.9 /100 | #33 | Exceptional 1.9% |
| Immigrants | Turkey | 99.8 /100 | #34 | Exceptional 1.9% |
| Immigrants | Australia | 99.8 /100 | #35 | Exceptional 1.9% |
| Cambodians | 99.8 /100 | #36 | Exceptional 2.0% |
| Bhutanese | 99.8 /100 | #37 | Exceptional 2.0% |