Macedonian vs Yaqui Vision Disability
COMPARE
Macedonian
Yaqui
Vision Disability
Vision Disability Comparison
Macedonians
Yaqui
2.0%
VISION DISABILITY
99.3/ 100
METRIC RATING
54th/ 347
METRIC RANK
2.5%
VISION DISABILITY
0.0/ 100
METRIC RATING
293rd/ 347
METRIC RANK
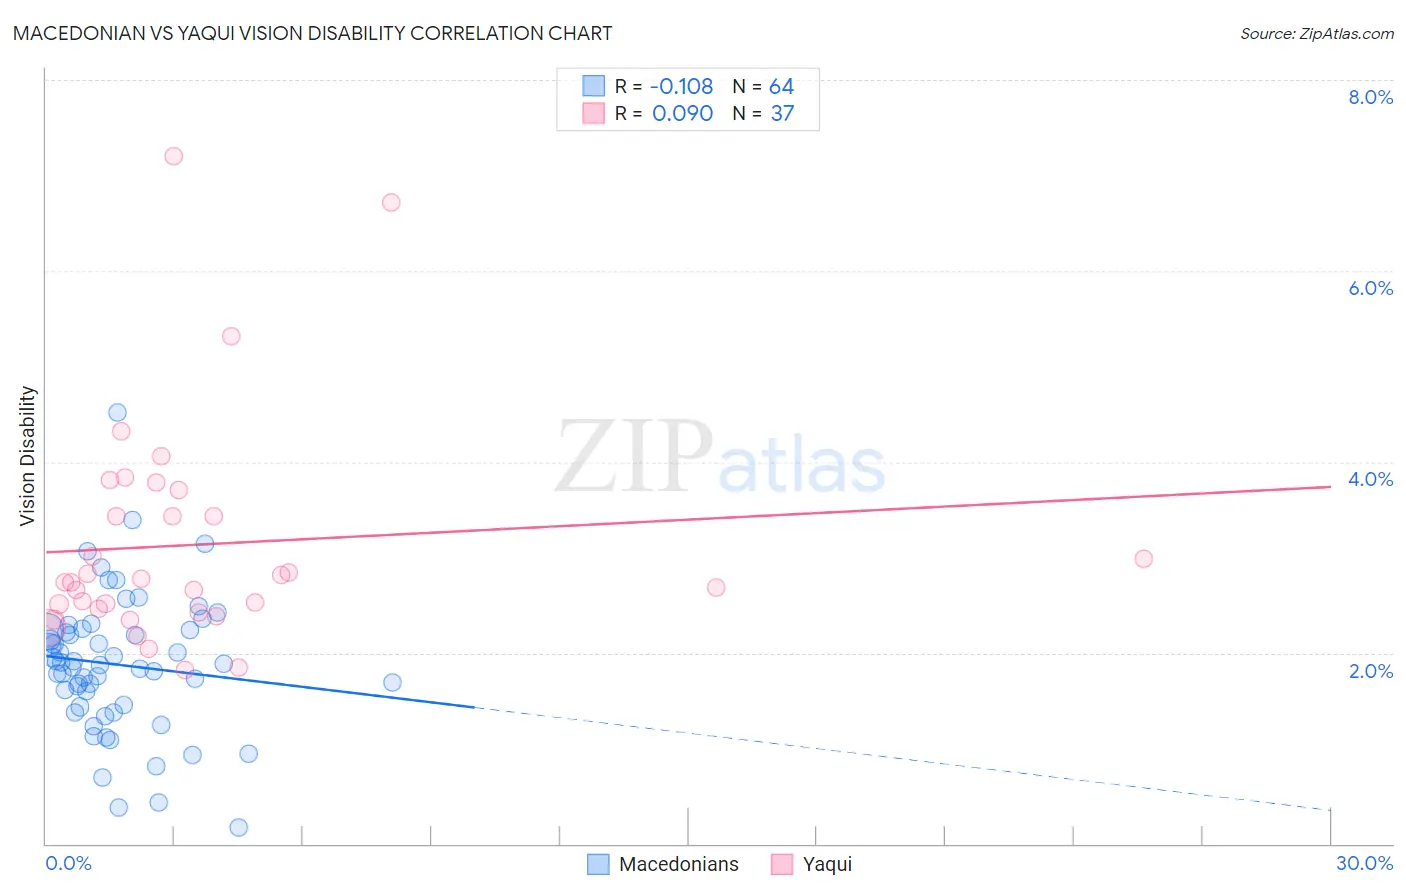
Macedonian vs Yaqui Vision Disability Correlation Chart
The statistical analysis conducted on geographies consisting of 132,627,302 people shows a poor negative correlation between the proportion of Macedonians and percentage of population with vision disability in the United States with a correlation coefficient (R) of -0.108 and weighted average of 2.0%. Similarly, the statistical analysis conducted on geographies consisting of 107,692,151 people shows a slight positive correlation between the proportion of Yaqui and percentage of population with vision disability in the United States with a correlation coefficient (R) of 0.090 and weighted average of 2.5%, a difference of 25.1%.
Vision Disability Correlation Summary
| Measurement | Macedonian | Yaqui |
| Minimum | 0.17% | 1.8% |
| Maximum | 4.5% | 7.2% |
| Range | 4.4% | 5.4% |
| Mean | 1.9% | 3.1% |
| Median | 1.9% | 2.7% |
| Interquartile 25% (IQ1) | 1.4% | 2.4% |
| Interquartile 75% (IQ3) | 2.2% | 3.6% |
| Interquartile Range (IQR) | 0.79% | 1.1% |
| Standard Deviation (Sample) | 0.73% | 1.2% |
| Standard Deviation (Population) | 0.73% | 1.2% |
Similar Demographics by Vision Disability
Demographics Similar to Macedonians by Vision Disability
In terms of vision disability, the demographic groups most similar to Macedonians are Immigrants from Belarus (2.0%, a difference of 0.040%), Laotian (2.0%, a difference of 0.060%), Immigrants from Serbia (2.0%, a difference of 0.15%), Jordanian (2.0%, a difference of 0.22%), and Somali (2.0%, a difference of 0.24%).
| Demographics | Rating | Rank | Vision Disability |
| Immigrants | Bulgaria | 99.7 /100 | #47 | Exceptional 2.0% |
| Israelis | 99.6 /100 | #48 | Exceptional 2.0% |
| Latvians | 99.5 /100 | #49 | Exceptional 2.0% |
| Afghans | 99.5 /100 | #50 | Exceptional 2.0% |
| Tongans | 99.5 /100 | #51 | Exceptional 2.0% |
| Immigrants | Serbia | 99.4 /100 | #52 | Exceptional 2.0% |
| Immigrants | Belarus | 99.3 /100 | #53 | Exceptional 2.0% |
| Macedonians | 99.3 /100 | #54 | Exceptional 2.0% |
| Laotians | 99.3 /100 | #55 | Exceptional 2.0% |
| Jordanians | 99.2 /100 | #56 | Exceptional 2.0% |
| Somalis | 99.2 /100 | #57 | Exceptional 2.0% |
| Immigrants | Saudi Arabia | 99.2 /100 | #58 | Exceptional 2.0% |
| Argentineans | 99.1 /100 | #59 | Exceptional 2.0% |
| Immigrants | Romania | 99.1 /100 | #60 | Exceptional 2.0% |
| Immigrants | Belgium | 99.1 /100 | #61 | Exceptional 2.0% |
Demographics Similar to Yaqui by Vision Disability
In terms of vision disability, the demographic groups most similar to Yaqui are Crow (2.5%, a difference of 0.030%), Immigrants from Honduras (2.5%, a difference of 0.12%), Ottawa (2.5%, a difference of 0.34%), Immigrants from Cuba (2.5%, a difference of 0.52%), and Delaware (2.5%, a difference of 0.55%).
| Demographics | Rating | Rank | Vision Disability |
| Sioux | 0.0 /100 | #286 | Tragic 2.5% |
| Hondurans | 0.0 /100 | #287 | Tragic 2.5% |
| French American Indians | 0.0 /100 | #288 | Tragic 2.5% |
| Immigrants | Nonimmigrants | 0.0 /100 | #289 | Tragic 2.5% |
| Immigrants | Cuba | 0.0 /100 | #290 | Tragic 2.5% |
| Immigrants | Honduras | 0.0 /100 | #291 | Tragic 2.5% |
| Crow | 0.0 /100 | #292 | Tragic 2.5% |
| Yaqui | 0.0 /100 | #293 | Tragic 2.5% |
| Ottawa | 0.0 /100 | #294 | Tragic 2.5% |
| Delaware | 0.0 /100 | #295 | Tragic 2.5% |
| Immigrants | Mexico | 0.0 /100 | #296 | Tragic 2.5% |
| Immigrants | Dominica | 0.0 /100 | #297 | Tragic 2.5% |
| Mexicans | 0.0 /100 | #298 | Tragic 2.5% |
| Cree | 0.0 /100 | #299 | Tragic 2.5% |
| Africans | 0.0 /100 | #300 | Tragic 2.5% |