Macedonian vs Croatian Vision Disability
COMPARE
Macedonian
Croatian
Vision Disability
Vision Disability Comparison
Macedonians
Croatians
2.0%
VISION DISABILITY
99.3/ 100
METRIC RATING
54th/ 347
METRIC RANK
2.1%
VISION DISABILITY
92.3/ 100
METRIC RATING
114th/ 347
METRIC RANK
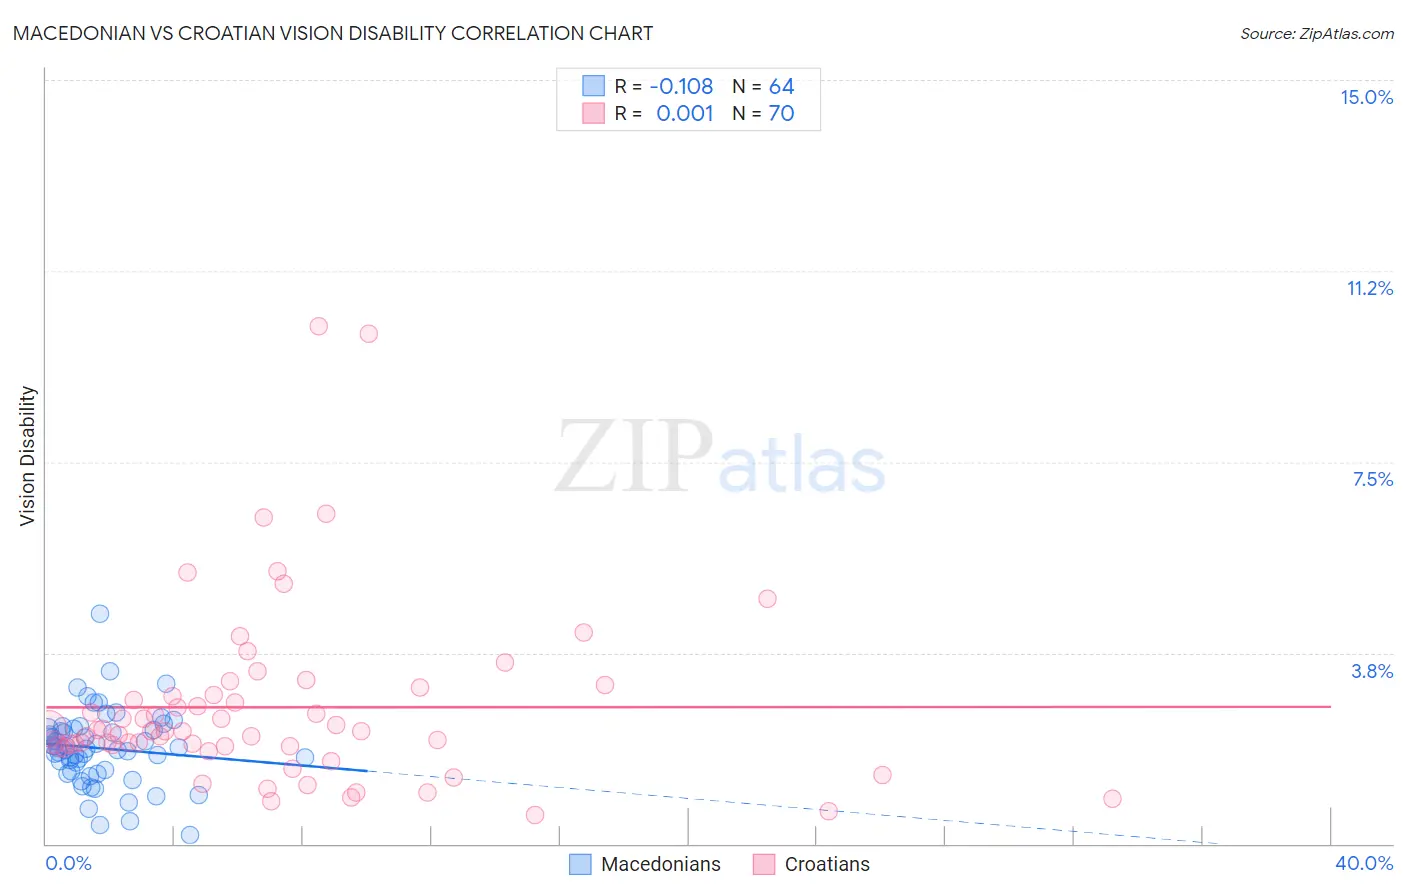
Macedonian vs Croatian Vision Disability Correlation Chart
The statistical analysis conducted on geographies consisting of 132,627,302 people shows a poor negative correlation between the proportion of Macedonians and percentage of population with vision disability in the United States with a correlation coefficient (R) of -0.108 and weighted average of 2.0%. Similarly, the statistical analysis conducted on geographies consisting of 375,377,812 people shows no correlation between the proportion of Croatians and percentage of population with vision disability in the United States with a correlation coefficient (R) of 0.001 and weighted average of 2.1%, a difference of 4.3%.
Vision Disability Correlation Summary
| Measurement | Macedonian | Croatian |
| Minimum | 0.17% | 0.57% |
| Maximum | 4.5% | 10.2% |
| Range | 4.4% | 9.6% |
| Mean | 1.9% | 2.7% |
| Median | 1.9% | 2.2% |
| Interquartile 25% (IQ1) | 1.4% | 1.9% |
| Interquartile 75% (IQ3) | 2.2% | 2.9% |
| Interquartile Range (IQR) | 0.79% | 1.00% |
| Standard Deviation (Sample) | 0.73% | 1.8% |
| Standard Deviation (Population) | 0.73% | 1.8% |
Similar Demographics by Vision Disability
Demographics Similar to Macedonians by Vision Disability
In terms of vision disability, the demographic groups most similar to Macedonians are Immigrants from Belarus (2.0%, a difference of 0.040%), Laotian (2.0%, a difference of 0.060%), Immigrants from Serbia (2.0%, a difference of 0.15%), Jordanian (2.0%, a difference of 0.22%), and Somali (2.0%, a difference of 0.24%).
| Demographics | Rating | Rank | Vision Disability |
| Immigrants | Bulgaria | 99.7 /100 | #47 | Exceptional 2.0% |
| Israelis | 99.6 /100 | #48 | Exceptional 2.0% |
| Latvians | 99.5 /100 | #49 | Exceptional 2.0% |
| Afghans | 99.5 /100 | #50 | Exceptional 2.0% |
| Tongans | 99.5 /100 | #51 | Exceptional 2.0% |
| Immigrants | Serbia | 99.4 /100 | #52 | Exceptional 2.0% |
| Immigrants | Belarus | 99.3 /100 | #53 | Exceptional 2.0% |
| Macedonians | 99.3 /100 | #54 | Exceptional 2.0% |
| Laotians | 99.3 /100 | #55 | Exceptional 2.0% |
| Jordanians | 99.2 /100 | #56 | Exceptional 2.0% |
| Somalis | 99.2 /100 | #57 | Exceptional 2.0% |
| Immigrants | Saudi Arabia | 99.2 /100 | #58 | Exceptional 2.0% |
| Argentineans | 99.1 /100 | #59 | Exceptional 2.0% |
| Immigrants | Romania | 99.1 /100 | #60 | Exceptional 2.0% |
| Immigrants | Belgium | 99.1 /100 | #61 | Exceptional 2.0% |
Demographics Similar to Croatians by Vision Disability
In terms of vision disability, the demographic groups most similar to Croatians are Immigrants from Vietnam (2.1%, a difference of 0.020%), Kenyan (2.1%, a difference of 0.030%), Ugandan (2.1%, a difference of 0.030%), Polish (2.1%, a difference of 0.070%), and Immigrants from Denmark (2.1%, a difference of 0.15%).
| Demographics | Rating | Rank | Vision Disability |
| Danes | 94.2 /100 | #107 | Exceptional 2.1% |
| Koreans | 94.1 /100 | #108 | Exceptional 2.1% |
| Chileans | 94.0 /100 | #109 | Exceptional 2.1% |
| Immigrants | Armenia | 93.8 /100 | #110 | Exceptional 2.1% |
| Peruvians | 93.5 /100 | #111 | Exceptional 2.1% |
| Immigrants | Denmark | 92.9 /100 | #112 | Exceptional 2.1% |
| Kenyans | 92.5 /100 | #113 | Exceptional 2.1% |
| Croatians | 92.3 /100 | #114 | Exceptional 2.1% |
| Immigrants | Vietnam | 92.2 /100 | #115 | Exceptional 2.1% |
| Ugandans | 92.2 /100 | #116 | Exceptional 2.1% |
| Poles | 92.0 /100 | #117 | Exceptional 2.1% |
| Immigrants | Philippines | 91.4 /100 | #118 | Exceptional 2.1% |
| Immigrants | Uganda | 91.4 /100 | #119 | Exceptional 2.1% |
| Immigrants | Zimbabwe | 91.0 /100 | #120 | Exceptional 2.1% |
| Immigrants | Scotland | 90.4 /100 | #121 | Exceptional 2.1% |