Macedonian vs Immigrants from Cambodia Hearing Disability
COMPARE
Macedonian
Immigrants from Cambodia
Hearing Disability
Hearing Disability Comparison
Macedonians
Immigrants from Cambodia
3.1%
HEARING DISABILITY
27.0/ 100
METRIC RATING
193rd/ 347
METRIC RANK
3.0%
HEARING DISABILITY
64.8/ 100
METRIC RATING
164th/ 347
METRIC RANK
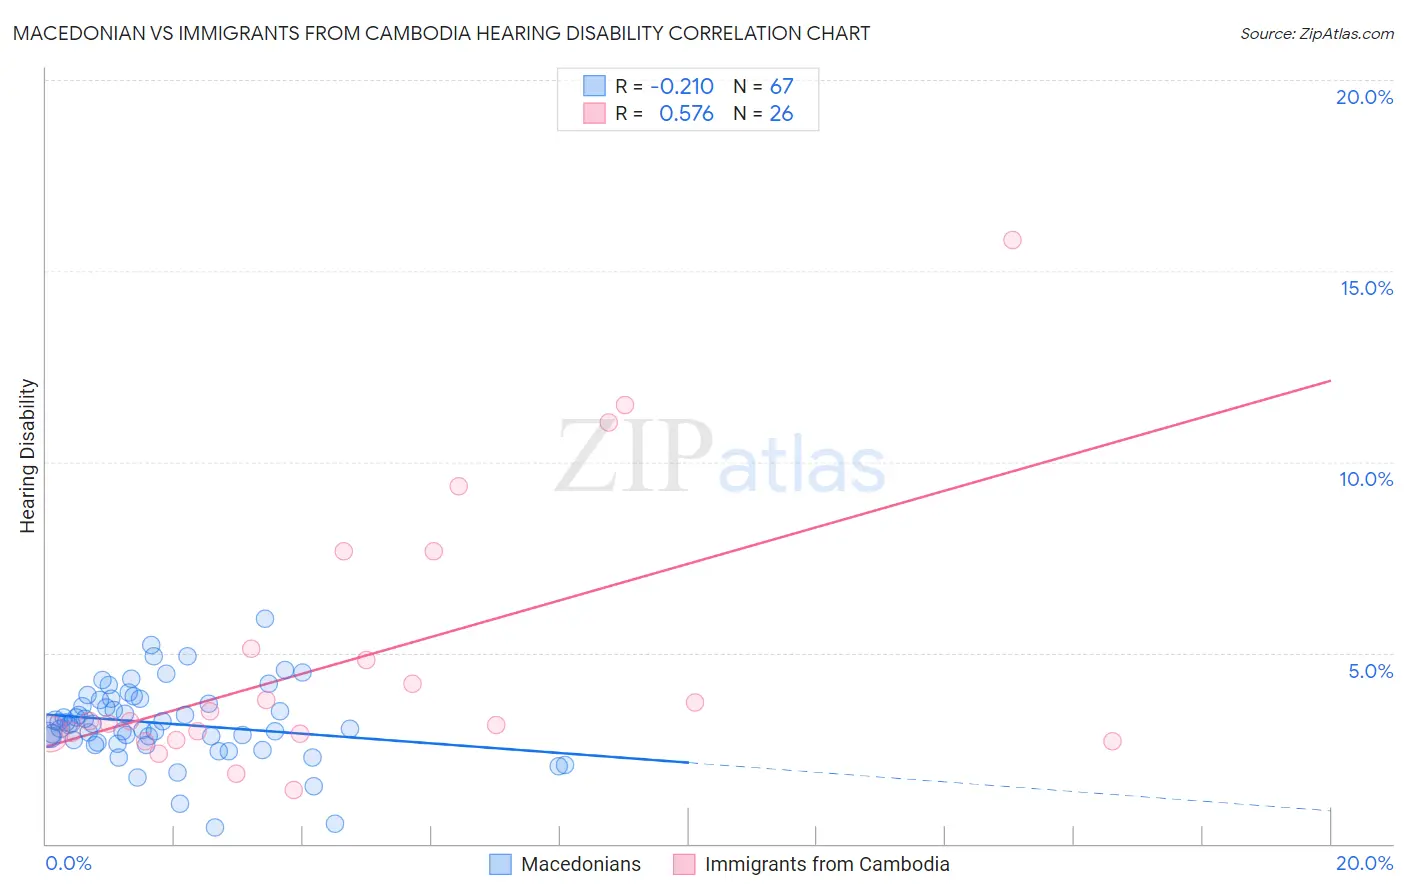
Macedonian vs Immigrants from Cambodia Hearing Disability Correlation Chart
The statistical analysis conducted on geographies consisting of 132,651,102 people shows a weak negative correlation between the proportion of Macedonians and percentage of population with hearing disability in the United States with a correlation coefficient (R) of -0.210 and weighted average of 3.1%. Similarly, the statistical analysis conducted on geographies consisting of 205,141,763 people shows a substantial positive correlation between the proportion of Immigrants from Cambodia and percentage of population with hearing disability in the United States with a correlation coefficient (R) of 0.576 and weighted average of 3.0%, a difference of 3.8%.
Hearing Disability Correlation Summary
| Measurement | Macedonian | Immigrants from Cambodia |
| Minimum | 0.44% | 1.4% |
| Maximum | 5.9% | 15.8% |
| Range | 5.4% | 14.4% |
| Mean | 3.2% | 4.9% |
| Median | 3.1% | 3.2% |
| Interquartile 25% (IQ1) | 2.7% | 2.9% |
| Interquartile 75% (IQ3) | 3.8% | 5.1% |
| Interquartile Range (IQR) | 1.1% | 2.2% |
| Standard Deviation (Sample) | 0.99% | 3.5% |
| Standard Deviation (Population) | 0.99% | 3.5% |
Similar Demographics by Hearing Disability
Demographics Similar to Macedonians by Hearing Disability
In terms of hearing disability, the demographic groups most similar to Macedonians are Korean (3.1%, a difference of 0.080%), Immigrants from Switzerland (3.1%, a difference of 0.21%), South African (3.1%, a difference of 0.30%), Spanish American Indian (3.1%, a difference of 0.35%), and Immigrants from South Africa (3.1%, a difference of 0.46%).
| Demographics | Rating | Rank | Hearing Disability |
| Immigrants | Mexico | 34.9 /100 | #186 | Fair 3.0% |
| Blacks/African Americans | 34.7 /100 | #187 | Fair 3.0% |
| Mexican American Indians | 34.7 /100 | #188 | Fair 3.0% |
| Africans | 32.9 /100 | #189 | Fair 3.0% |
| Immigrants | South Africa | 31.1 /100 | #190 | Fair 3.1% |
| Immigrants | Switzerland | 28.8 /100 | #191 | Fair 3.1% |
| Koreans | 27.6 /100 | #192 | Fair 3.1% |
| Macedonians | 27.0 /100 | #193 | Fair 3.1% |
| South Africans | 24.5 /100 | #194 | Fair 3.1% |
| Spanish American Indians | 24.1 /100 | #195 | Fair 3.1% |
| Immigrants | Europe | 22.9 /100 | #196 | Fair 3.1% |
| Immigrants | Bosnia and Herzegovina | 20.6 /100 | #197 | Fair 3.1% |
| Immigrants | Croatia | 20.5 /100 | #198 | Fair 3.1% |
| Syrians | 19.2 /100 | #199 | Poor 3.1% |
| Immigrants | North Macedonia | 19.1 /100 | #200 | Poor 3.1% |
Demographics Similar to Immigrants from Cambodia by Hearing Disability
In terms of hearing disability, the demographic groups most similar to Immigrants from Cambodia are Immigrants from Central America (3.0%, a difference of 0.020%), Immigrants from Zimbabwe (3.0%, a difference of 0.060%), Immigrants from Japan (2.9%, a difference of 0.16%), Albanian (2.9%, a difference of 0.19%), and Immigrants from South Eastern Asia (3.0%, a difference of 0.20%).
| Demographics | Rating | Rank | Hearing Disability |
| Immigrants | Kazakhstan | 69.6 /100 | #157 | Good 2.9% |
| Immigrants | Burma/Myanmar | 69.5 /100 | #158 | Good 2.9% |
| Immigrants | Australia | 67.4 /100 | #159 | Good 2.9% |
| Immigrants | Fiji | 67.1 /100 | #160 | Good 2.9% |
| Albanians | 66.6 /100 | #161 | Good 2.9% |
| Immigrants | Japan | 66.3 /100 | #162 | Good 2.9% |
| Immigrants | Central America | 64.9 /100 | #163 | Good 3.0% |
| Immigrants | Cambodia | 64.8 /100 | #164 | Good 3.0% |
| Immigrants | Zimbabwe | 64.2 /100 | #165 | Good 3.0% |
| Immigrants | South Eastern Asia | 62.9 /100 | #166 | Good 3.0% |
| Immigrants | Eastern Europe | 58.1 /100 | #167 | Average 3.0% |
| Immigrants | Greece | 57.9 /100 | #168 | Average 3.0% |
| Arabs | 57.6 /100 | #169 | Average 3.0% |
| Immigrants | Cabo Verde | 56.9 /100 | #170 | Average 3.0% |
| Immigrants | Ukraine | 56.6 /100 | #171 | Average 3.0% |