Macedonian vs Serbian Hearing Disability
COMPARE
Macedonian
Serbian
Hearing Disability
Hearing Disability Comparison
Macedonians
Serbians
3.1%
HEARING DISABILITY
27.0/ 100
METRIC RATING
193rd/ 347
METRIC RANK
3.3%
HEARING DISABILITY
2.2/ 100
METRIC RATING
236th/ 347
METRIC RANK
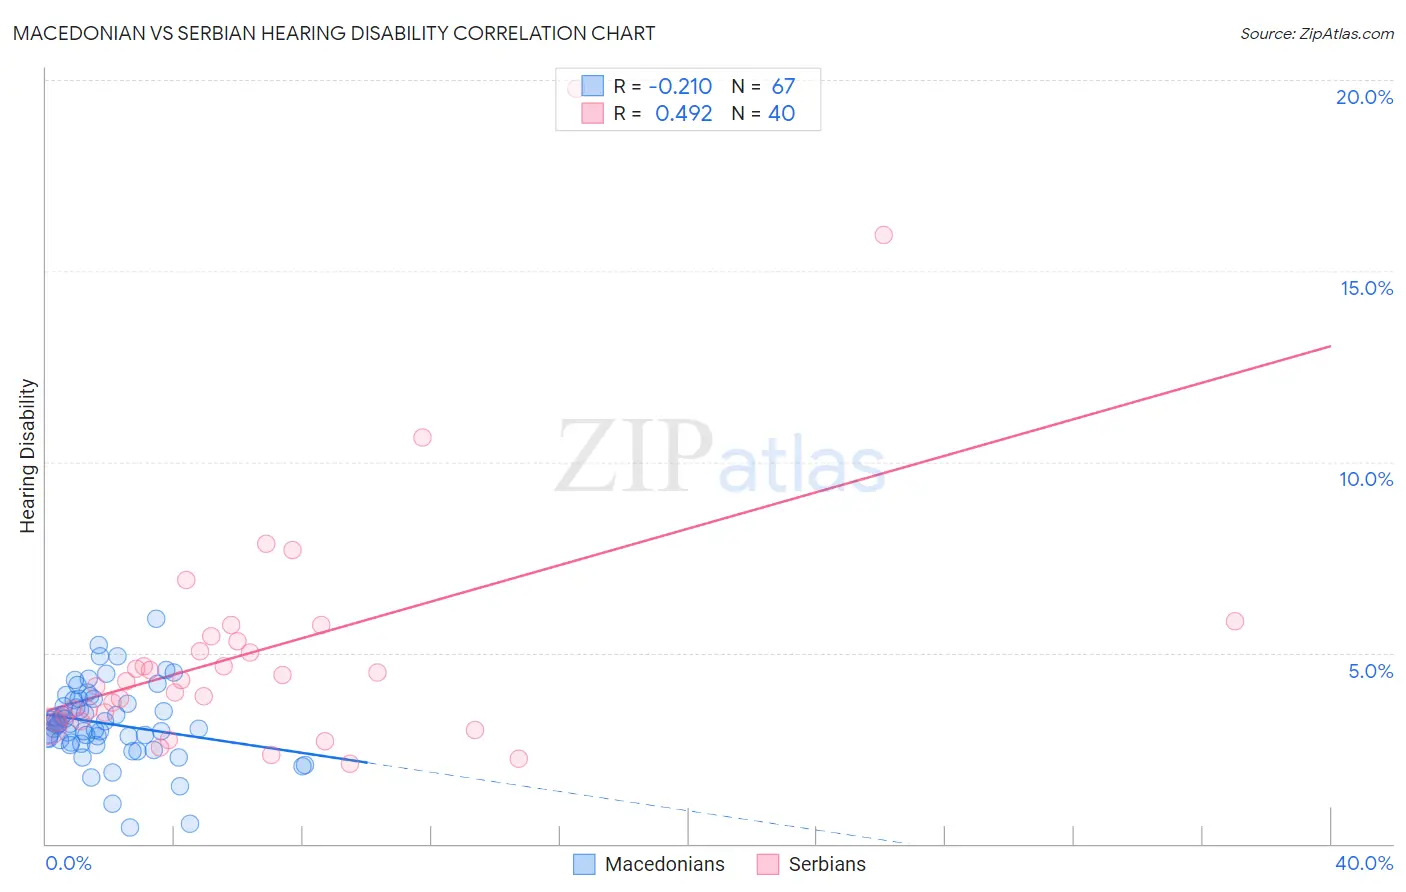
Macedonian vs Serbian Hearing Disability Correlation Chart
The statistical analysis conducted on geographies consisting of 132,651,102 people shows a weak negative correlation between the proportion of Macedonians and percentage of population with hearing disability in the United States with a correlation coefficient (R) of -0.210 and weighted average of 3.1%. Similarly, the statistical analysis conducted on geographies consisting of 267,622,098 people shows a moderate positive correlation between the proportion of Serbians and percentage of population with hearing disability in the United States with a correlation coefficient (R) of 0.492 and weighted average of 3.3%, a difference of 6.5%.
Hearing Disability Correlation Summary
| Measurement | Macedonian | Serbian |
| Minimum | 0.44% | 2.1% |
| Maximum | 5.9% | 19.8% |
| Range | 5.4% | 17.7% |
| Mean | 3.2% | 5.1% |
| Median | 3.1% | 4.3% |
| Interquartile 25% (IQ1) | 2.7% | 3.3% |
| Interquartile 75% (IQ3) | 3.8% | 5.4% |
| Interquartile Range (IQR) | 1.1% | 2.1% |
| Standard Deviation (Sample) | 0.99% | 3.4% |
| Standard Deviation (Population) | 0.99% | 3.4% |
Similar Demographics by Hearing Disability
Demographics Similar to Macedonians by Hearing Disability
In terms of hearing disability, the demographic groups most similar to Macedonians are Korean (3.1%, a difference of 0.080%), Immigrants from Switzerland (3.1%, a difference of 0.21%), South African (3.1%, a difference of 0.30%), Spanish American Indian (3.1%, a difference of 0.35%), and Immigrants from South Africa (3.1%, a difference of 0.46%).
| Demographics | Rating | Rank | Hearing Disability |
| Immigrants | Mexico | 34.9 /100 | #186 | Fair 3.0% |
| Blacks/African Americans | 34.7 /100 | #187 | Fair 3.0% |
| Mexican American Indians | 34.7 /100 | #188 | Fair 3.0% |
| Africans | 32.9 /100 | #189 | Fair 3.0% |
| Immigrants | South Africa | 31.1 /100 | #190 | Fair 3.1% |
| Immigrants | Switzerland | 28.8 /100 | #191 | Fair 3.1% |
| Koreans | 27.6 /100 | #192 | Fair 3.1% |
| Macedonians | 27.0 /100 | #193 | Fair 3.1% |
| South Africans | 24.5 /100 | #194 | Fair 3.1% |
| Spanish American Indians | 24.1 /100 | #195 | Fair 3.1% |
| Immigrants | Europe | 22.9 /100 | #196 | Fair 3.1% |
| Immigrants | Bosnia and Herzegovina | 20.6 /100 | #197 | Fair 3.1% |
| Immigrants | Croatia | 20.5 /100 | #198 | Fair 3.1% |
| Syrians | 19.2 /100 | #199 | Poor 3.1% |
| Immigrants | North Macedonia | 19.1 /100 | #200 | Poor 3.1% |
Demographics Similar to Serbians by Hearing Disability
In terms of hearing disability, the demographic groups most similar to Serbians are Guamanian/Chamorro (3.3%, a difference of 0.060%), Central American Indian (3.3%, a difference of 0.17%), Estonian (3.3%, a difference of 0.24%), Immigrants from Austria (3.3%, a difference of 0.39%), and German Russian (3.3%, a difference of 0.39%).
| Demographics | Rating | Rank | Hearing Disability |
| Maltese | 4.1 /100 | #229 | Tragic 3.2% |
| Greeks | 3.2 /100 | #230 | Tragic 3.2% |
| Luxembourgers | 2.9 /100 | #231 | Tragic 3.2% |
| Ukrainians | 2.9 /100 | #232 | Tragic 3.2% |
| Estonians | 2.4 /100 | #233 | Tragic 3.3% |
| Central American Indians | 2.3 /100 | #234 | Tragic 3.3% |
| Guamanians/Chamorros | 2.2 /100 | #235 | Tragic 3.3% |
| Serbians | 2.2 /100 | #236 | Tragic 3.3% |
| Immigrants | Austria | 1.8 /100 | #237 | Tragic 3.3% |
| German Russians | 1.8 /100 | #238 | Tragic 3.3% |
| Nepalese | 1.2 /100 | #239 | Tragic 3.3% |
| Immigrants | Netherlands | 1.1 /100 | #240 | Tragic 3.3% |
| Samoans | 1.1 /100 | #241 | Tragic 3.3% |
| Yugoslavians | 1.0 /100 | #242 | Tragic 3.3% |
| Immigrants | Western Europe | 1.0 /100 | #243 | Tragic 3.3% |