Immigrants from Cabo Verde vs Immigrants from Cambodia Hearing Disability
COMPARE
Immigrants from Cabo Verde
Immigrants from Cambodia
Hearing Disability
Hearing Disability Comparison
Immigrants from Cabo Verde
Immigrants from Cambodia
3.0%
HEARING DISABILITY
56.9/ 100
METRIC RATING
170th/ 347
METRIC RANK
3.0%
HEARING DISABILITY
64.8/ 100
METRIC RATING
164th/ 347
METRIC RANK
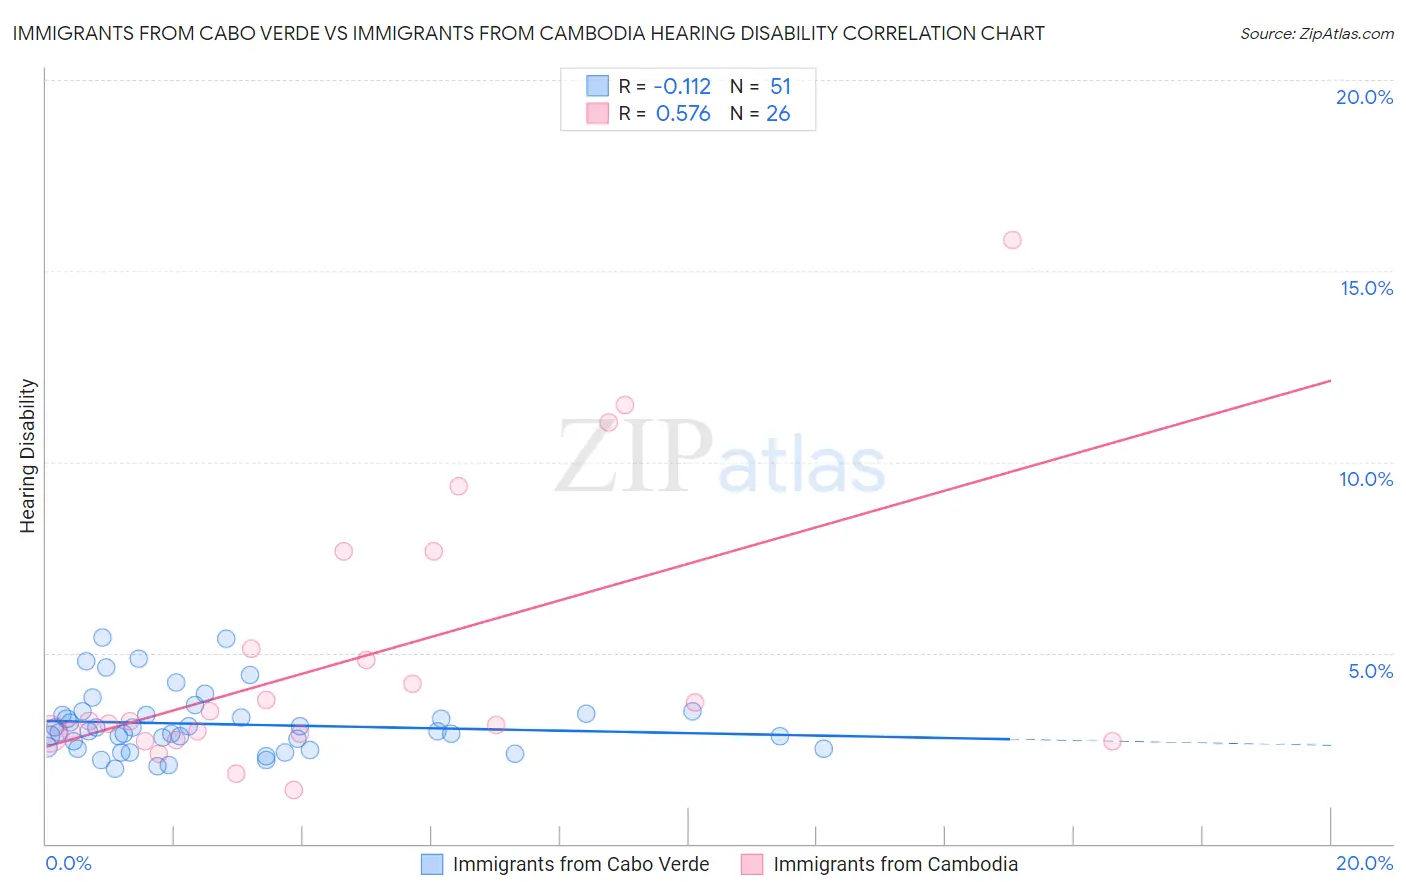
Immigrants from Cabo Verde vs Immigrants from Cambodia Hearing Disability Correlation Chart
The statistical analysis conducted on geographies consisting of 38,139,523 people shows a poor negative correlation between the proportion of Immigrants from Cabo Verde and percentage of population with hearing disability in the United States with a correlation coefficient (R) of -0.112 and weighted average of 3.0%. Similarly, the statistical analysis conducted on geographies consisting of 205,141,763 people shows a substantial positive correlation between the proportion of Immigrants from Cambodia and percentage of population with hearing disability in the United States with a correlation coefficient (R) of 0.576 and weighted average of 3.0%, a difference of 0.79%.
Hearing Disability Correlation Summary
| Measurement | Immigrants from Cabo Verde | Immigrants from Cambodia |
| Minimum | 2.0% | 1.4% |
| Maximum | 5.4% | 15.8% |
| Range | 3.4% | 14.4% |
| Mean | 3.1% | 4.9% |
| Median | 2.9% | 3.2% |
| Interquartile 25% (IQ1) | 2.5% | 2.9% |
| Interquartile 75% (IQ3) | 3.4% | 5.1% |
| Interquartile Range (IQR) | 0.92% | 2.2% |
| Standard Deviation (Sample) | 0.82% | 3.5% |
| Standard Deviation (Population) | 0.82% | 3.5% |
Demographics Similar to Immigrants from Cabo Verde and Immigrants from Cambodia by Hearing Disability
In terms of hearing disability, the demographic groups most similar to Immigrants from Cabo Verde are Immigrants from Ukraine (3.0%, a difference of 0.030%), Arab (3.0%, a difference of 0.070%), Armenian (3.0%, a difference of 0.090%), Immigrants from Greece (3.0%, a difference of 0.10%), and Immigrants from Eastern Europe (3.0%, a difference of 0.11%). Similarly, the demographic groups most similar to Immigrants from Cambodia are Immigrants from Central America (3.0%, a difference of 0.020%), Immigrants from Zimbabwe (3.0%, a difference of 0.060%), Immigrants from Japan (2.9%, a difference of 0.16%), Albanian (2.9%, a difference of 0.19%), and Immigrants from South Eastern Asia (3.0%, a difference of 0.20%).
| Demographics | Rating | Rank | Hearing Disability |
| Immigrants | Kazakhstan | 69.6 /100 | #157 | Good 2.9% |
| Immigrants | Burma/Myanmar | 69.5 /100 | #158 | Good 2.9% |
| Immigrants | Australia | 67.4 /100 | #159 | Good 2.9% |
| Immigrants | Fiji | 67.1 /100 | #160 | Good 2.9% |
| Albanians | 66.6 /100 | #161 | Good 2.9% |
| Immigrants | Japan | 66.3 /100 | #162 | Good 2.9% |
| Immigrants | Central America | 64.9 /100 | #163 | Good 3.0% |
| Immigrants | Cambodia | 64.8 /100 | #164 | Good 3.0% |
| Immigrants | Zimbabwe | 64.2 /100 | #165 | Good 3.0% |
| Immigrants | South Eastern Asia | 62.9 /100 | #166 | Good 3.0% |
| Immigrants | Eastern Europe | 58.1 /100 | #167 | Average 3.0% |
| Immigrants | Greece | 57.9 /100 | #168 | Average 3.0% |
| Arabs | 57.6 /100 | #169 | Average 3.0% |
| Immigrants | Cabo Verde | 56.9 /100 | #170 | Average 3.0% |
| Immigrants | Ukraine | 56.6 /100 | #171 | Average 3.0% |
| Armenians | 56.0 /100 | #172 | Average 3.0% |
| Immigrants | Serbia | 51.1 /100 | #173 | Average 3.0% |
| Indonesians | 50.0 /100 | #174 | Average 3.0% |
| Immigrants | Romania | 48.4 /100 | #175 | Average 3.0% |
| Panamanians | 47.0 /100 | #176 | Average 3.0% |
| Immigrants | Philippines | 46.4 /100 | #177 | Average 3.0% |