Macedonian vs Immigrants from Cambodia 11th Grade
COMPARE
Macedonian
Immigrants from Cambodia
11th Grade
11th Grade Comparison
Macedonians
Immigrants from Cambodia
94.1%
11TH GRADE
99.9/ 100
METRIC RATING
48th/ 347
METRIC RANK
89.6%
11TH GRADE
0.0/ 100
METRIC RATING
305th/ 347
METRIC RANK
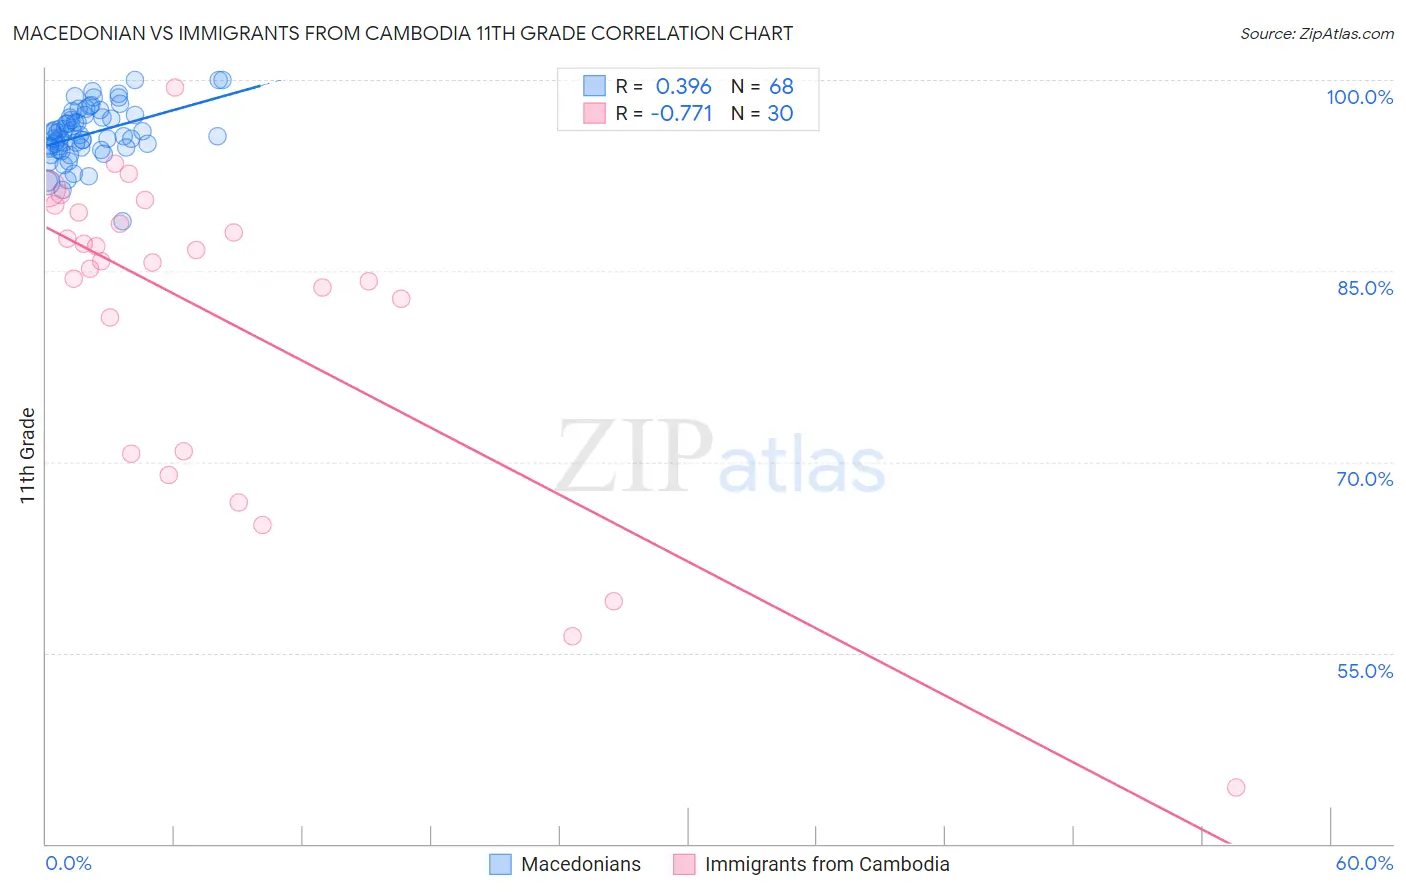
Macedonian vs Immigrants from Cambodia 11th Grade Correlation Chart
The statistical analysis conducted on geographies consisting of 132,646,607 people shows a mild positive correlation between the proportion of Macedonians and percentage of population with at least 11th grade education in the United States with a correlation coefficient (R) of 0.396 and weighted average of 94.1%. Similarly, the statistical analysis conducted on geographies consisting of 205,153,442 people shows a strong negative correlation between the proportion of Immigrants from Cambodia and percentage of population with at least 11th grade education in the United States with a correlation coefficient (R) of -0.771 and weighted average of 89.6%, a difference of 4.9%.
11th Grade Correlation Summary
| Measurement | Macedonian | Immigrants from Cambodia |
| Minimum | 88.9% | 44.4% |
| Maximum | 100.0% | 99.4% |
| Range | 11.1% | 54.9% |
| Mean | 95.8% | 81.3% |
| Median | 95.6% | 85.7% |
| Interquartile 25% (IQ1) | 94.7% | 70.9% |
| Interquartile 75% (IQ3) | 97.1% | 89.6% |
| Interquartile Range (IQR) | 2.5% | 18.7% |
| Standard Deviation (Sample) | 2.2% | 12.7% |
| Standard Deviation (Population) | 2.1% | 12.5% |
Similar Demographics by 11th Grade
Demographics Similar to Macedonians by 11th Grade
In terms of 11th grade, the demographic groups most similar to Macedonians are Filipino (94.1%, a difference of 0.0%), Slavic (94.1%, a difference of 0.0%), French (94.1%, a difference of 0.0%), Serbian (94.1%, a difference of 0.010%), and Australian (94.1%, a difference of 0.020%).
| Demographics | Rating | Rank | 11th Grade |
| Cypriots | 99.9 /100 | #41 | Exceptional 94.1% |
| Immigrants | Austria | 99.9 /100 | #42 | Exceptional 94.1% |
| Greeks | 99.9 /100 | #43 | Exceptional 94.1% |
| Immigrants | Ireland | 99.9 /100 | #44 | Exceptional 94.1% |
| Australians | 99.9 /100 | #45 | Exceptional 94.1% |
| Serbians | 99.9 /100 | #46 | Exceptional 94.1% |
| Filipinos | 99.9 /100 | #47 | Exceptional 94.1% |
| Macedonians | 99.9 /100 | #48 | Exceptional 94.1% |
| Slavs | 99.9 /100 | #49 | Exceptional 94.1% |
| French | 99.9 /100 | #50 | Exceptional 94.1% |
| Turks | 99.9 /100 | #51 | Exceptional 94.0% |
| Immigrants | Canada | 99.9 /100 | #52 | Exceptional 94.0% |
| Immigrants | Australia | 99.9 /100 | #53 | Exceptional 94.0% |
| Immigrants | North America | 99.9 /100 | #54 | Exceptional 94.0% |
| Czechoslovakians | 99.9 /100 | #55 | Exceptional 94.0% |
Demographics Similar to Immigrants from Cambodia by 11th Grade
In terms of 11th grade, the demographic groups most similar to Immigrants from Cambodia are Ecuadorian (89.6%, a difference of 0.050%), Immigrants (89.7%, a difference of 0.080%), Yuman (89.7%, a difference of 0.080%), Immigrants from Guyana (89.7%, a difference of 0.090%), and Immigrants from Dominica (89.5%, a difference of 0.10%).
| Demographics | Rating | Rank | 11th Grade |
| Immigrants | Fiji | 0.0 /100 | #298 | Tragic 89.9% |
| Japanese | 0.0 /100 | #299 | Tragic 89.9% |
| Immigrants | Haiti | 0.0 /100 | #300 | Tragic 89.9% |
| Guyanese | 0.0 /100 | #301 | Tragic 89.9% |
| Immigrants | Guyana | 0.0 /100 | #302 | Tragic 89.7% |
| Immigrants | Immigrants | 0.0 /100 | #303 | Tragic 89.7% |
| Yuman | 0.0 /100 | #304 | Tragic 89.7% |
| Immigrants | Cambodia | 0.0 /100 | #305 | Tragic 89.6% |
| Ecuadorians | 0.0 /100 | #306 | Tragic 89.6% |
| Immigrants | Dominica | 0.0 /100 | #307 | Tragic 89.5% |
| Nepalese | 0.0 /100 | #308 | Tragic 89.5% |
| Immigrants | Bangladesh | 0.0 /100 | #309 | Tragic 89.5% |
| Yaqui | 0.0 /100 | #310 | Tragic 89.5% |
| Vietnamese | 0.0 /100 | #311 | Tragic 89.4% |
| Immigrants | Portugal | 0.0 /100 | #312 | Tragic 89.3% |