Immigrants from Kazakhstan vs Croatian Vision Disability
COMPARE
Immigrants from Kazakhstan
Croatian
Vision Disability
Vision Disability Comparison
Immigrants from Kazakhstan
Croatians
2.0%
VISION DISABILITY
98.6/ 100
METRIC RATING
70th/ 347
METRIC RANK
2.1%
VISION DISABILITY
92.3/ 100
METRIC RATING
114th/ 347
METRIC RANK
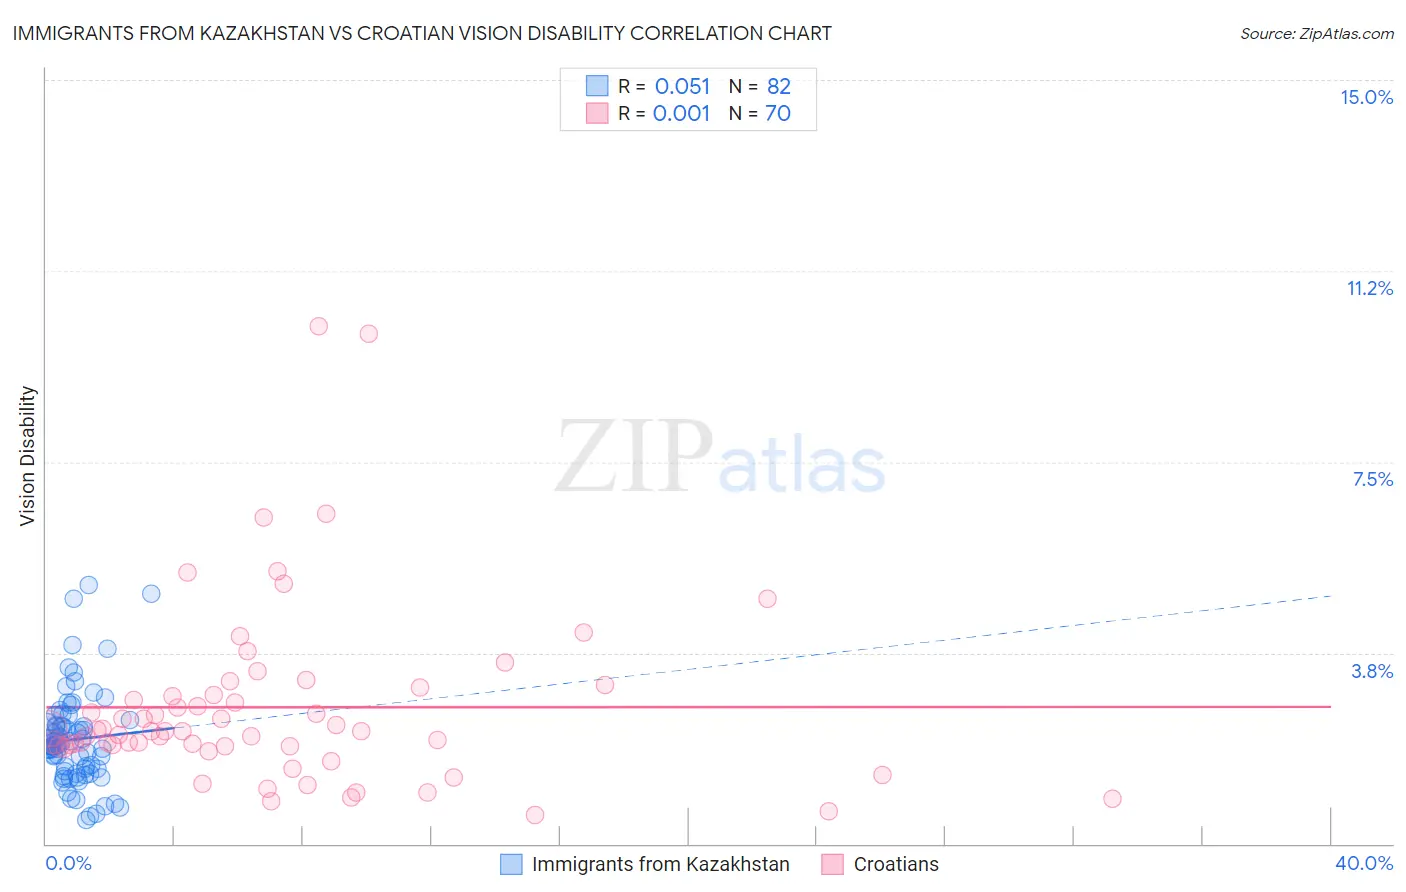
Immigrants from Kazakhstan vs Croatian Vision Disability Correlation Chart
The statistical analysis conducted on geographies consisting of 124,421,317 people shows a slight positive correlation between the proportion of Immigrants from Kazakhstan and percentage of population with vision disability in the United States with a correlation coefficient (R) of 0.051 and weighted average of 2.0%. Similarly, the statistical analysis conducted on geographies consisting of 375,377,812 people shows no correlation between the proportion of Croatians and percentage of population with vision disability in the United States with a correlation coefficient (R) of 0.001 and weighted average of 2.1%, a difference of 3.0%.
Vision Disability Correlation Summary
| Measurement | Immigrants from Kazakhstan | Croatian |
| Minimum | 0.47% | 0.57% |
| Maximum | 5.1% | 10.2% |
| Range | 4.6% | 9.6% |
| Mean | 2.0% | 2.7% |
| Median | 1.9% | 2.2% |
| Interquartile 25% (IQ1) | 1.5% | 1.9% |
| Interquartile 75% (IQ3) | 2.3% | 2.9% |
| Interquartile Range (IQR) | 0.85% | 1.00% |
| Standard Deviation (Sample) | 0.91% | 1.8% |
| Standard Deviation (Population) | 0.90% | 1.8% |
Similar Demographics by Vision Disability
Demographics Similar to Immigrants from Kazakhstan by Vision Disability
In terms of vision disability, the demographic groups most similar to Immigrants from Kazakhstan are Immigrants from Northern Europe (2.0%, a difference of 0.010%), Russian (2.0%, a difference of 0.020%), Immigrants from France (2.0%, a difference of 0.060%), Immigrants from Czechoslovakia (2.0%, a difference of 0.19%), and Immigrants from Eritrea (2.0%, a difference of 0.26%).
| Demographics | Rating | Rank | Vision Disability |
| Armenians | 99.0 /100 | #63 | Exceptional 2.0% |
| Immigrants | Greece | 99.0 /100 | #64 | Exceptional 2.0% |
| Maltese | 98.9 /100 | #65 | Exceptional 2.0% |
| Immigrants | Argentina | 98.9 /100 | #66 | Exceptional 2.0% |
| Immigrants | Northern Africa | 98.8 /100 | #67 | Exceptional 2.0% |
| Immigrants | Czechoslovakia | 98.7 /100 | #68 | Exceptional 2.0% |
| Russians | 98.6 /100 | #69 | Exceptional 2.0% |
| Immigrants | Kazakhstan | 98.6 /100 | #70 | Exceptional 2.0% |
| Immigrants | Northern Europe | 98.6 /100 | #71 | Exceptional 2.0% |
| Immigrants | France | 98.5 /100 | #72 | Exceptional 2.0% |
| Immigrants | Eritrea | 98.4 /100 | #73 | Exceptional 2.0% |
| Palestinians | 98.3 /100 | #74 | Exceptional 2.0% |
| Immigrants | North Macedonia | 98.3 /100 | #75 | Exceptional 2.0% |
| Paraguayans | 98.3 /100 | #76 | Exceptional 2.0% |
| Immigrants | Jordan | 98.3 /100 | #77 | Exceptional 2.0% |
Demographics Similar to Croatians by Vision Disability
In terms of vision disability, the demographic groups most similar to Croatians are Immigrants from Vietnam (2.1%, a difference of 0.020%), Kenyan (2.1%, a difference of 0.030%), Ugandan (2.1%, a difference of 0.030%), Polish (2.1%, a difference of 0.070%), and Immigrants from Denmark (2.1%, a difference of 0.15%).
| Demographics | Rating | Rank | Vision Disability |
| Danes | 94.2 /100 | #107 | Exceptional 2.1% |
| Koreans | 94.1 /100 | #108 | Exceptional 2.1% |
| Chileans | 94.0 /100 | #109 | Exceptional 2.1% |
| Immigrants | Armenia | 93.8 /100 | #110 | Exceptional 2.1% |
| Peruvians | 93.5 /100 | #111 | Exceptional 2.1% |
| Immigrants | Denmark | 92.9 /100 | #112 | Exceptional 2.1% |
| Kenyans | 92.5 /100 | #113 | Exceptional 2.1% |
| Croatians | 92.3 /100 | #114 | Exceptional 2.1% |
| Immigrants | Vietnam | 92.2 /100 | #115 | Exceptional 2.1% |
| Ugandans | 92.2 /100 | #116 | Exceptional 2.1% |
| Poles | 92.0 /100 | #117 | Exceptional 2.1% |
| Immigrants | Philippines | 91.4 /100 | #118 | Exceptional 2.1% |
| Immigrants | Uganda | 91.4 /100 | #119 | Exceptional 2.1% |
| Immigrants | Zimbabwe | 91.0 /100 | #120 | Exceptional 2.1% |
| Immigrants | Scotland | 90.4 /100 | #121 | Exceptional 2.1% |