Kiowa vs Croatian Vision Disability
COMPARE
Kiowa
Croatian
Vision Disability
Vision Disability Comparison
Kiowa
Croatians
3.3%
VISION DISABILITY
0.0/ 100
METRIC RATING
341st/ 347
METRIC RANK
2.1%
VISION DISABILITY
92.3/ 100
METRIC RATING
114th/ 347
METRIC RANK
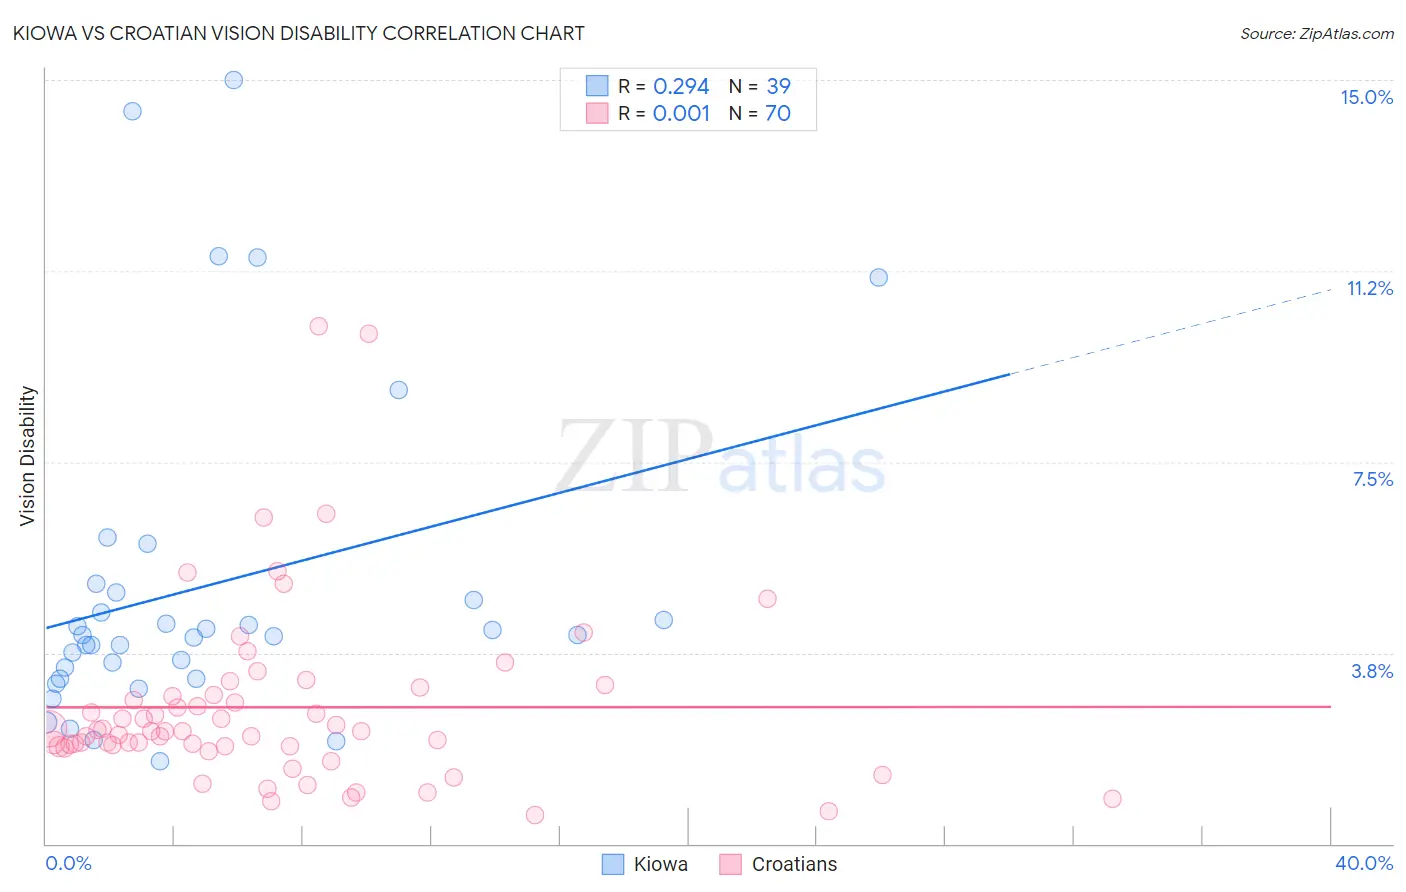
Kiowa vs Croatian Vision Disability Correlation Chart
The statistical analysis conducted on geographies consisting of 56,085,396 people shows a weak positive correlation between the proportion of Kiowa and percentage of population with vision disability in the United States with a correlation coefficient (R) of 0.294 and weighted average of 3.3%. Similarly, the statistical analysis conducted on geographies consisting of 375,377,812 people shows no correlation between the proportion of Croatians and percentage of population with vision disability in the United States with a correlation coefficient (R) of 0.001 and weighted average of 2.1%, a difference of 56.2%.
Vision Disability Correlation Summary
| Measurement | Kiowa | Croatian |
| Minimum | 1.6% | 0.57% |
| Maximum | 15.0% | 10.2% |
| Range | 13.4% | 9.6% |
| Mean | 5.1% | 2.7% |
| Median | 4.1% | 2.2% |
| Interquartile 25% (IQ1) | 3.2% | 1.9% |
| Interquartile 75% (IQ3) | 4.9% | 2.9% |
| Interquartile Range (IQR) | 1.7% | 1.00% |
| Standard Deviation (Sample) | 3.3% | 1.8% |
| Standard Deviation (Population) | 3.2% | 1.8% |
Similar Demographics by Vision Disability
Demographics Similar to Kiowa by Vision Disability
In terms of vision disability, the demographic groups most similar to Kiowa are Choctaw (3.3%, a difference of 1.4%), Creek (3.2%, a difference of 1.4%), Tsimshian (3.2%, a difference of 1.6%), Chickasaw (3.2%, a difference of 2.3%), and Pima (3.3%, a difference of 2.5%).
| Demographics | Rating | Rank | Vision Disability |
| Cajuns | 0.0 /100 | #333 | Tragic 3.1% |
| Cheyenne | 0.0 /100 | #334 | Tragic 3.1% |
| Navajo | 0.0 /100 | #335 | Tragic 3.1% |
| Alaskan Athabascans | 0.0 /100 | #336 | Tragic 3.1% |
| Dutch West Indians | 0.0 /100 | #337 | Tragic 3.2% |
| Chickasaw | 0.0 /100 | #338 | Tragic 3.2% |
| Tsimshian | 0.0 /100 | #339 | Tragic 3.2% |
| Creek | 0.0 /100 | #340 | Tragic 3.2% |
| Kiowa | 0.0 /100 | #341 | Tragic 3.3% |
| Choctaw | 0.0 /100 | #342 | Tragic 3.3% |
| Pima | 0.0 /100 | #343 | Tragic 3.3% |
| Pueblo | 0.0 /100 | #344 | Tragic 3.3% |
| Lumbee | 0.0 /100 | #345 | Tragic 3.4% |
| Houma | 0.0 /100 | #346 | Tragic 3.4% |
| Puerto Ricans | 0.0 /100 | #347 | Tragic 3.9% |
Demographics Similar to Croatians by Vision Disability
In terms of vision disability, the demographic groups most similar to Croatians are Immigrants from Vietnam (2.1%, a difference of 0.020%), Kenyan (2.1%, a difference of 0.030%), Ugandan (2.1%, a difference of 0.030%), Polish (2.1%, a difference of 0.070%), and Immigrants from Denmark (2.1%, a difference of 0.15%).
| Demographics | Rating | Rank | Vision Disability |
| Danes | 94.2 /100 | #107 | Exceptional 2.1% |
| Koreans | 94.1 /100 | #108 | Exceptional 2.1% |
| Chileans | 94.0 /100 | #109 | Exceptional 2.1% |
| Immigrants | Armenia | 93.8 /100 | #110 | Exceptional 2.1% |
| Peruvians | 93.5 /100 | #111 | Exceptional 2.1% |
| Immigrants | Denmark | 92.9 /100 | #112 | Exceptional 2.1% |
| Kenyans | 92.5 /100 | #113 | Exceptional 2.1% |
| Croatians | 92.3 /100 | #114 | Exceptional 2.1% |
| Immigrants | Vietnam | 92.2 /100 | #115 | Exceptional 2.1% |
| Ugandans | 92.2 /100 | #116 | Exceptional 2.1% |
| Poles | 92.0 /100 | #117 | Exceptional 2.1% |
| Immigrants | Philippines | 91.4 /100 | #118 | Exceptional 2.1% |
| Immigrants | Uganda | 91.4 /100 | #119 | Exceptional 2.1% |
| Immigrants | Zimbabwe | 91.0 /100 | #120 | Exceptional 2.1% |
| Immigrants | Scotland | 90.4 /100 | #121 | Exceptional 2.1% |