Luxembourger vs Osage Nursery School
COMPARE
Luxembourger
Osage
Nursery School
Nursery School Comparison
Luxembourgers
Osage
98.5%
NURSERY SCHOOL
99.9/ 100
METRIC RATING
41st/ 347
METRIC RANK
98.3%
NURSERY SCHOOL
99.1/ 100
METRIC RATING
83rd/ 347
METRIC RANK
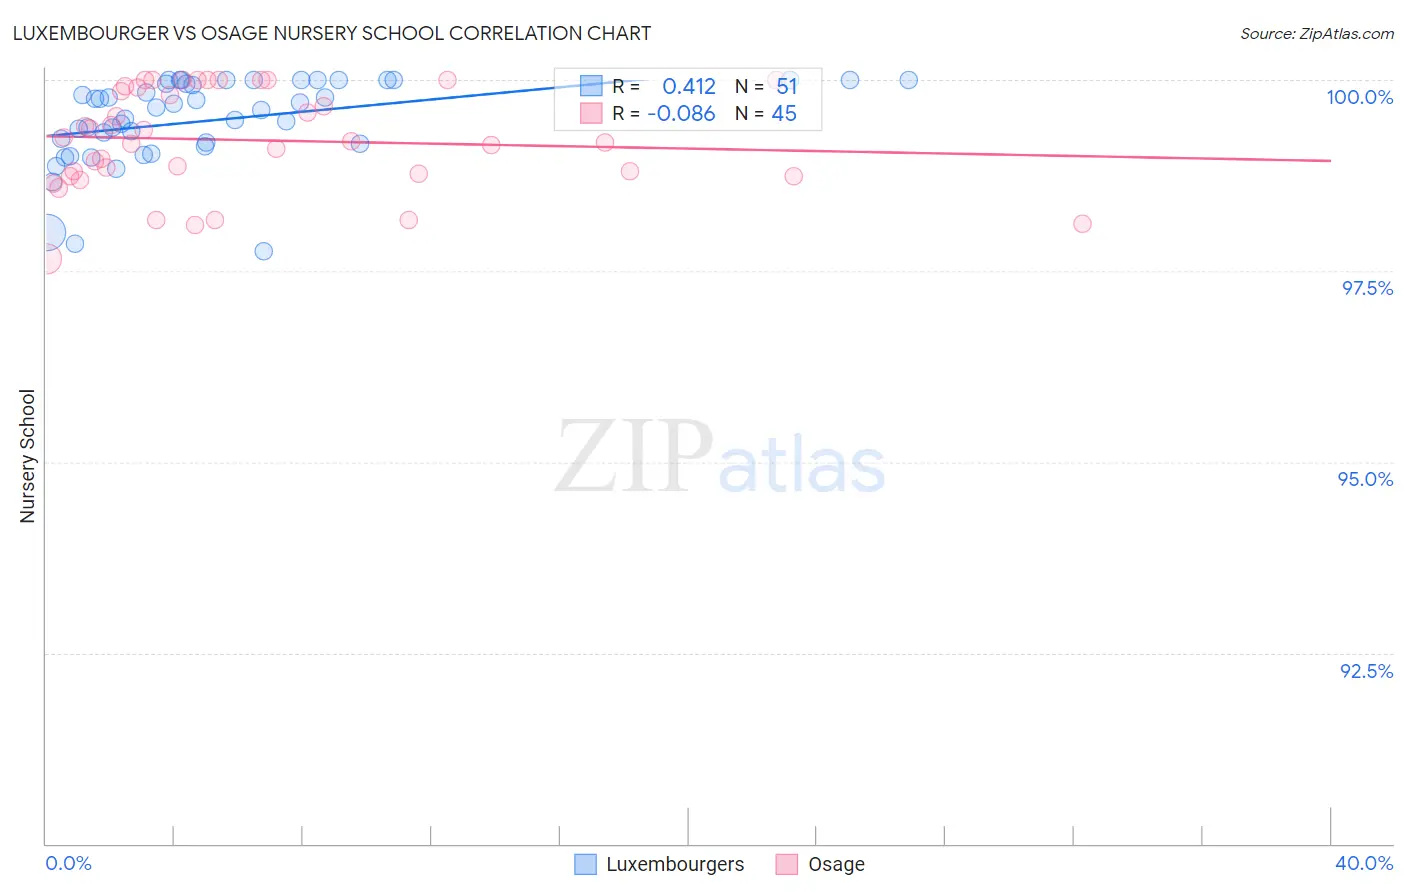
Luxembourger vs Osage Nursery School Correlation Chart
The statistical analysis conducted on geographies consisting of 144,675,804 people shows a moderate positive correlation between the proportion of Luxembourgers and percentage of population with at least nursery school education in the United States with a correlation coefficient (R) of 0.412 and weighted average of 98.5%. Similarly, the statistical analysis conducted on geographies consisting of 91,808,929 people shows a slight negative correlation between the proportion of Osage and percentage of population with at least nursery school education in the United States with a correlation coefficient (R) of -0.086 and weighted average of 98.3%, a difference of 0.18%.
Nursery School Correlation Summary
| Measurement | Luxembourger | Osage |
| Minimum | 97.8% | 97.7% |
| Maximum | 100.0% | 100.0% |
| Range | 2.2% | 2.3% |
| Mean | 99.5% | 99.2% |
| Median | 99.6% | 99.2% |
| Interquartile 25% (IQ1) | 99.2% | 98.8% |
| Interquartile 75% (IQ3) | 100.0% | 99.9% |
| Interquartile Range (IQR) | 0.83% | 1.1% |
| Standard Deviation (Sample) | 0.56% | 0.66% |
| Standard Deviation (Population) | 0.56% | 0.65% |
Similar Demographics by Nursery School
Demographics Similar to Luxembourgers by Nursery School
In terms of nursery school, the demographic groups most similar to Luxembourgers are Eastern European (98.5%, a difference of 0.0%), Latvian (98.5%, a difference of 0.010%), Chippewa (98.5%, a difference of 0.010%), Native Hawaiian (98.5%, a difference of 0.010%), and Belgian (98.5%, a difference of 0.010%).
| Demographics | Rating | Rank | Nursery School |
| Chinese | 100.0 /100 | #34 | Exceptional 98.6% |
| Swiss | 100.0 /100 | #35 | Exceptional 98.6% |
| British | 100.0 /100 | #36 | Exceptional 98.5% |
| Lumbee | 99.9 /100 | #37 | Exceptional 98.5% |
| Italians | 99.9 /100 | #38 | Exceptional 98.5% |
| Latvians | 99.9 /100 | #39 | Exceptional 98.5% |
| Chippewa | 99.9 /100 | #40 | Exceptional 98.5% |
| Luxembourgers | 99.9 /100 | #41 | Exceptional 98.5% |
| Eastern Europeans | 99.9 /100 | #42 | Exceptional 98.5% |
| Native Hawaiians | 99.9 /100 | #43 | Exceptional 98.5% |
| Belgians | 99.9 /100 | #44 | Exceptional 98.5% |
| Northern Europeans | 99.9 /100 | #45 | Exceptional 98.5% |
| Hungarians | 99.9 /100 | #46 | Exceptional 98.5% |
| Czechoslovakians | 99.9 /100 | #47 | Exceptional 98.5% |
| Ottawa | 99.8 /100 | #48 | Exceptional 98.5% |
Demographics Similar to Osage by Nursery School
In terms of nursery school, the demographic groups most similar to Osage are Immigrants from Denmark (98.3%, a difference of 0.0%), Immigrants from Sweden (98.3%, a difference of 0.0%), Immigrants from Belgium (98.3%, a difference of 0.010%), Shoshone (98.3%, a difference of 0.010%), and Icelander (98.3%, a difference of 0.010%).
| Demographics | Rating | Rank | Nursery School |
| Immigrants | England | 99.3 /100 | #76 | Exceptional 98.3% |
| Immigrants | Lithuania | 99.3 /100 | #77 | Exceptional 98.3% |
| Delaware | 99.3 /100 | #78 | Exceptional 98.3% |
| Immigrants | Belgium | 99.3 /100 | #79 | Exceptional 98.3% |
| Shoshone | 99.3 /100 | #80 | Exceptional 98.3% |
| Icelanders | 99.2 /100 | #81 | Exceptional 98.3% |
| Potawatomi | 99.2 /100 | #82 | Exceptional 98.3% |
| Osage | 99.1 /100 | #83 | Exceptional 98.3% |
| Immigrants | Denmark | 99.1 /100 | #84 | Exceptional 98.3% |
| Immigrants | Sweden | 99.1 /100 | #85 | Exceptional 98.3% |
| Immigrants | Australia | 99.0 /100 | #86 | Exceptional 98.3% |
| Hopi | 98.9 /100 | #87 | Exceptional 98.3% |
| Ukrainians | 98.9 /100 | #88 | Exceptional 98.3% |
| Immigrants | South Africa | 98.8 /100 | #89 | Exceptional 98.3% |
| Immigrants | Western Europe | 98.8 /100 | #90 | Exceptional 98.3% |