Luxembourger vs Immigrants from Ethiopia Hearing Disability
COMPARE
Luxembourger
Immigrants from Ethiopia
Hearing Disability
Hearing Disability Comparison
Luxembourgers
Immigrants from Ethiopia
3.2%
HEARING DISABILITY
2.9/ 100
METRIC RATING
231st/ 347
METRIC RANK
2.7%
HEARING DISABILITY
99.0/ 100
METRIC RATING
55th/ 347
METRIC RANK
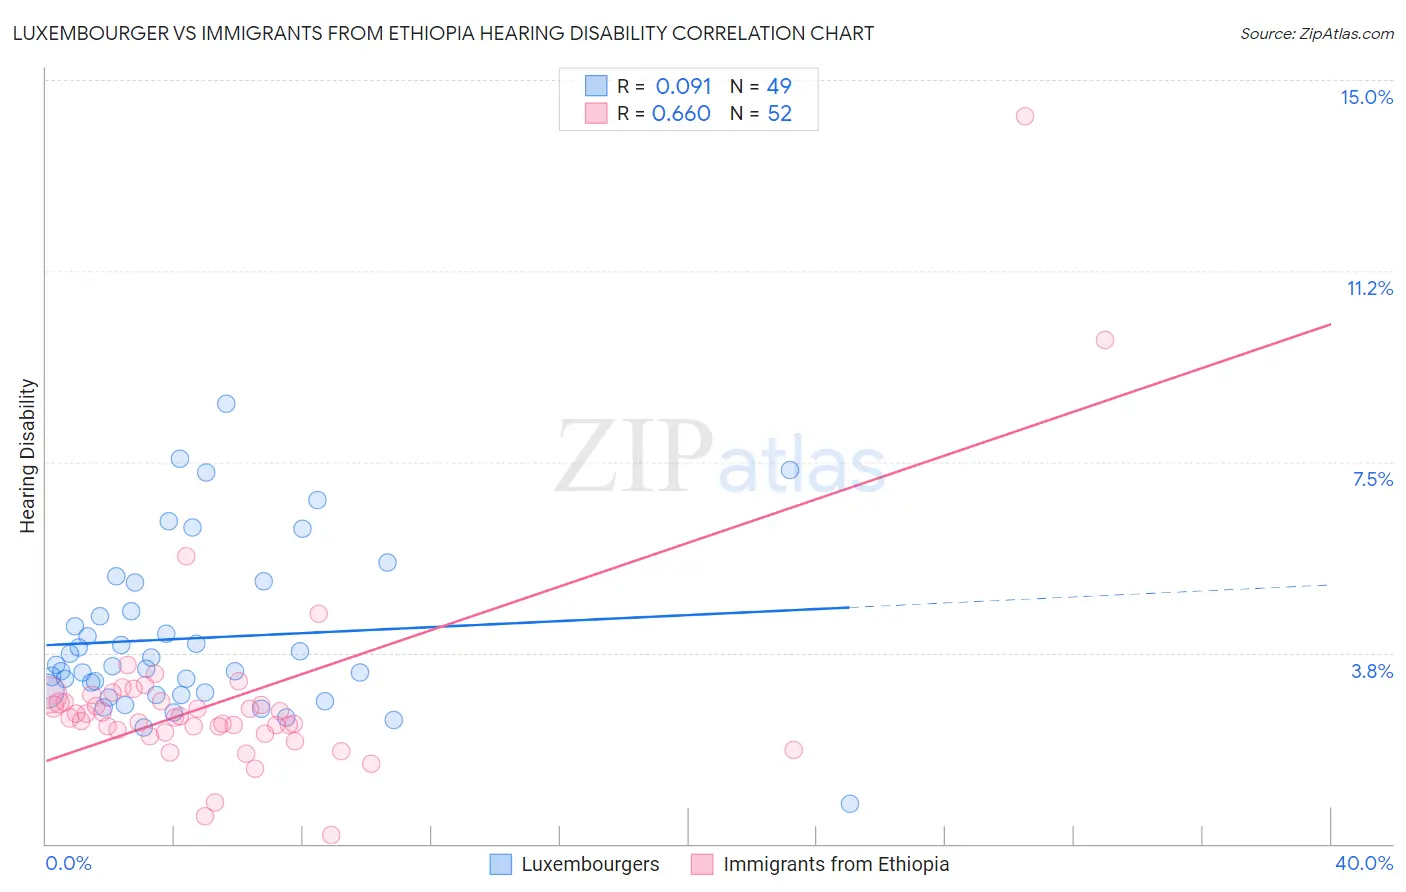
Luxembourger vs Immigrants from Ethiopia Hearing Disability Correlation Chart
The statistical analysis conducted on geographies consisting of 144,678,787 people shows a slight positive correlation between the proportion of Luxembourgers and percentage of population with hearing disability in the United States with a correlation coefficient (R) of 0.091 and weighted average of 3.2%. Similarly, the statistical analysis conducted on geographies consisting of 211,510,601 people shows a significant positive correlation between the proportion of Immigrants from Ethiopia and percentage of population with hearing disability in the United States with a correlation coefficient (R) of 0.660 and weighted average of 2.7%, a difference of 21.2%.
Hearing Disability Correlation Summary
| Measurement | Luxembourger | Immigrants from Ethiopia |
| Minimum | 0.78% | 0.17% |
| Maximum | 8.6% | 14.3% |
| Range | 7.9% | 14.1% |
| Mean | 4.0% | 2.8% |
| Median | 3.5% | 2.5% |
| Interquartile 25% (IQ1) | 2.9% | 2.2% |
| Interquartile 75% (IQ3) | 4.9% | 2.9% |
| Interquartile Range (IQR) | 1.9% | 0.64% |
| Standard Deviation (Sample) | 1.6% | 2.1% |
| Standard Deviation (Population) | 1.6% | 2.1% |
Similar Demographics by Hearing Disability
Demographics Similar to Luxembourgers by Hearing Disability
In terms of hearing disability, the demographic groups most similar to Luxembourgers are Ukrainian (3.2%, a difference of 0.050%), Greek (3.2%, a difference of 0.23%), Estonian (3.3%, a difference of 0.42%), Central American Indian (3.3%, a difference of 0.49%), and Guamanian/Chamorro (3.3%, a difference of 0.60%).
| Demographics | Rating | Rank | Hearing Disability |
| Icelanders | 5.2 /100 | #224 | Tragic 3.2% |
| Latvians | 5.1 /100 | #225 | Tragic 3.2% |
| Lebanese | 5.0 /100 | #226 | Tragic 3.2% |
| Bhutanese | 4.6 /100 | #227 | Tragic 3.2% |
| Immigrants | Portugal | 4.3 /100 | #228 | Tragic 3.2% |
| Maltese | 4.1 /100 | #229 | Tragic 3.2% |
| Greeks | 3.2 /100 | #230 | Tragic 3.2% |
| Luxembourgers | 2.9 /100 | #231 | Tragic 3.2% |
| Ukrainians | 2.9 /100 | #232 | Tragic 3.2% |
| Estonians | 2.4 /100 | #233 | Tragic 3.3% |
| Central American Indians | 2.3 /100 | #234 | Tragic 3.3% |
| Guamanians/Chamorros | 2.2 /100 | #235 | Tragic 3.3% |
| Serbians | 2.2 /100 | #236 | Tragic 3.3% |
| Immigrants | Austria | 1.8 /100 | #237 | Tragic 3.3% |
| German Russians | 1.8 /100 | #238 | Tragic 3.3% |
Demographics Similar to Immigrants from Ethiopia by Hearing Disability
In terms of hearing disability, the demographic groups most similar to Immigrants from Ethiopia are Immigrants from Nicaragua (2.7%, a difference of 0.020%), Ethiopian (2.7%, a difference of 0.060%), South American (2.7%, a difference of 0.070%), Immigrants from Eastern Asia (2.7%, a difference of 0.10%), and Jamaican (2.7%, a difference of 0.16%).
| Demographics | Rating | Rank | Hearing Disability |
| Immigrants | Singapore | 99.3 /100 | #48 | Exceptional 2.6% |
| Immigrants | South America | 99.2 /100 | #49 | Exceptional 2.7% |
| Paraguayans | 99.2 /100 | #50 | Exceptional 2.7% |
| Immigrants | Hong Kong | 99.2 /100 | #51 | Exceptional 2.7% |
| Jamaicans | 99.0 /100 | #52 | Exceptional 2.7% |
| Immigrants | Eastern Asia | 99.0 /100 | #53 | Exceptional 2.7% |
| Ethiopians | 99.0 /100 | #54 | Exceptional 2.7% |
| Immigrants | Ethiopia | 99.0 /100 | #55 | Exceptional 2.7% |
| Immigrants | Nicaragua | 99.0 /100 | #56 | Exceptional 2.7% |
| South Americans | 99.0 /100 | #57 | Exceptional 2.7% |
| Immigrants | Peru | 98.6 /100 | #58 | Exceptional 2.7% |
| Immigrants | Eritrea | 98.5 /100 | #59 | Exceptional 2.7% |
| Immigrants | Egypt | 98.5 /100 | #60 | Exceptional 2.7% |
| Immigrants | Uzbekistan | 98.4 /100 | #61 | Exceptional 2.7% |
| Immigrants | Colombia | 98.4 /100 | #62 | Exceptional 2.7% |