Luxembourger vs Immigrants from Ethiopia Unemployment Among Ages 35 to 44 years
COMPARE
Luxembourger
Immigrants from Ethiopia
Unemployment Among Ages 35 to 44 years
Unemployment Among Ages 35 to 44 years Comparison
Luxembourgers
Immigrants from Ethiopia
4.3%
UNEMPLOYMENT AMONG AGES 35 TO 44 YEARS
99.0/ 100
METRIC RATING
35th/ 347
METRIC RANK
4.5%
UNEMPLOYMENT AMONG AGES 35 TO 44 YEARS
84.7/ 100
METRIC RATING
127th/ 347
METRIC RANK
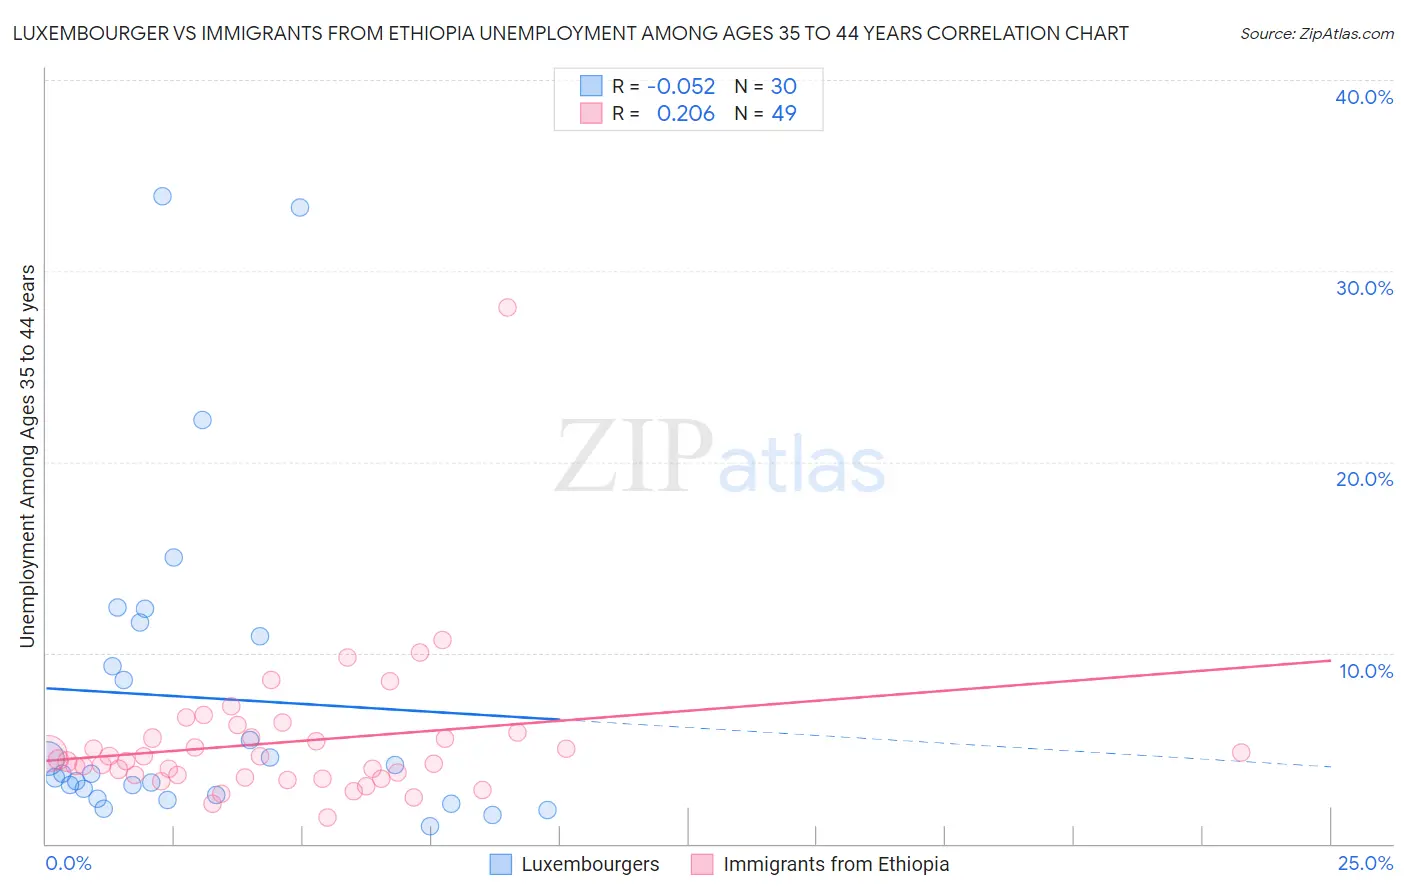
Luxembourger vs Immigrants from Ethiopia Unemployment Among Ages 35 to 44 years Correlation Chart
The statistical analysis conducted on geographies consisting of 142,430,740 people shows a slight negative correlation between the proportion of Luxembourgers and unemployment rate among population between the ages 35 and 44 in the United States with a correlation coefficient (R) of -0.052 and weighted average of 4.3%. Similarly, the statistical analysis conducted on geographies consisting of 209,718,778 people shows a weak positive correlation between the proportion of Immigrants from Ethiopia and unemployment rate among population between the ages 35 and 44 in the United States with a correlation coefficient (R) of 0.206 and weighted average of 4.5%, a difference of 5.5%.
Unemployment Among Ages 35 to 44 years Correlation Summary
| Measurement | Luxembourger | Immigrants from Ethiopia |
| Minimum | 0.90% | 1.4% |
| Maximum | 33.9% | 28.1% |
| Range | 33.0% | 26.7% |
| Mean | 7.7% | 5.3% |
| Median | 3.7% | 4.4% |
| Interquartile 25% (IQ1) | 2.6% | 3.5% |
| Interquartile 75% (IQ3) | 10.9% | 5.7% |
| Interquartile Range (IQR) | 8.3% | 2.1% |
| Standard Deviation (Sample) | 8.6% | 3.9% |
| Standard Deviation (Population) | 8.4% | 3.8% |
Similar Demographics by Unemployment Among Ages 35 to 44 years
Demographics Similar to Luxembourgers by Unemployment Among Ages 35 to 44 years
In terms of unemployment among ages 35 to 44 years, the demographic groups most similar to Luxembourgers are Jordanian (4.3%, a difference of 0.030%), Mongolian (4.3%, a difference of 0.10%), Immigrants from Zimbabwe (4.3%, a difference of 0.15%), Immigrants from Sri Lanka (4.3%, a difference of 0.18%), and Burmese (4.3%, a difference of 0.22%).
| Demographics | Rating | Rank | Unemployment Among Ages 35 to 44 years |
| Immigrants | Japan | 99.3 /100 | #28 | Exceptional 4.3% |
| Europeans | 99.2 /100 | #29 | Exceptional 4.3% |
| Immigrants | Pakistan | 99.2 /100 | #30 | Exceptional 4.3% |
| Carpatho Rusyns | 99.2 /100 | #31 | Exceptional 4.3% |
| Chinese | 99.1 /100 | #32 | Exceptional 4.3% |
| Immigrants | Sri Lanka | 99.1 /100 | #33 | Exceptional 4.3% |
| Jordanians | 99.0 /100 | #34 | Exceptional 4.3% |
| Luxembourgers | 99.0 /100 | #35 | Exceptional 4.3% |
| Mongolians | 98.9 /100 | #36 | Exceptional 4.3% |
| Immigrants | Zimbabwe | 98.9 /100 | #37 | Exceptional 4.3% |
| Burmese | 98.9 /100 | #38 | Exceptional 4.3% |
| Palestinians | 98.8 /100 | #39 | Exceptional 4.3% |
| Zimbabweans | 98.8 /100 | #40 | Exceptional 4.3% |
| Belgians | 98.7 /100 | #41 | Exceptional 4.3% |
| Germans | 98.7 /100 | #42 | Exceptional 4.3% |
Demographics Similar to Immigrants from Ethiopia by Unemployment Among Ages 35 to 44 years
In terms of unemployment among ages 35 to 44 years, the demographic groups most similar to Immigrants from Ethiopia are Immigrants from Austria (4.5%, a difference of 0.010%), Czechoslovakian (4.6%, a difference of 0.17%), Immigrants from Northern Africa (4.5%, a difference of 0.20%), Immigrants from Spain (4.5%, a difference of 0.21%), and Immigrants from Croatia (4.6%, a difference of 0.21%).
| Demographics | Rating | Rank | Unemployment Among Ages 35 to 44 years |
| Ethiopians | 87.1 /100 | #120 | Excellent 4.5% |
| Immigrants | South Africa | 86.8 /100 | #121 | Excellent 4.5% |
| Sri Lankans | 86.8 /100 | #122 | Excellent 4.5% |
| Basques | 86.3 /100 | #123 | Excellent 4.5% |
| Immigrants | Spain | 86.1 /100 | #124 | Excellent 4.5% |
| Immigrants | Northern Africa | 86.1 /100 | #125 | Excellent 4.5% |
| Immigrants | Austria | 84.7 /100 | #126 | Excellent 4.5% |
| Immigrants | Ethiopia | 84.7 /100 | #127 | Excellent 4.5% |
| Czechoslovakians | 83.4 /100 | #128 | Excellent 4.6% |
| Immigrants | Croatia | 83.1 /100 | #129 | Excellent 4.6% |
| Immigrants | Eritrea | 82.8 /100 | #130 | Excellent 4.6% |
| Immigrants | Colombia | 82.6 /100 | #131 | Excellent 4.6% |
| Colombians | 80.8 /100 | #132 | Excellent 4.6% |
| Syrians | 80.7 /100 | #133 | Excellent 4.6% |
| Laotians | 80.1 /100 | #134 | Excellent 4.6% |