Luxembourger vs Hmong Hearing Disability
COMPARE
Luxembourger
Hmong
Hearing Disability
Hearing Disability Comparison
Luxembourgers
Hmong
3.2%
HEARING DISABILITY
2.9/ 100
METRIC RATING
231st/ 347
METRIC RANK
3.4%
HEARING DISABILITY
0.2/ 100
METRIC RATING
256th/ 347
METRIC RANK
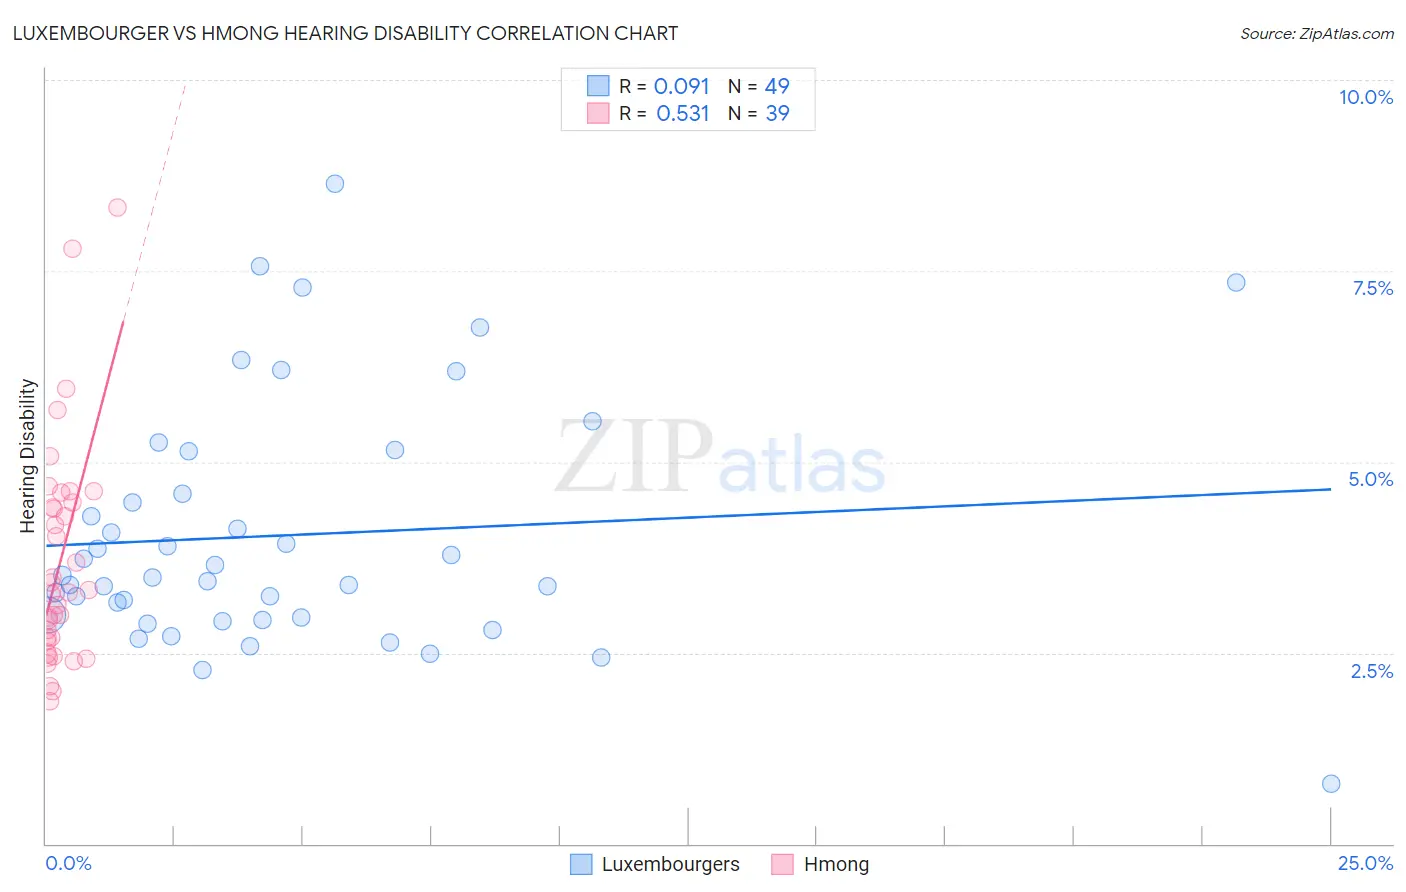
Luxembourger vs Hmong Hearing Disability Correlation Chart
The statistical analysis conducted on geographies consisting of 144,678,787 people shows a slight positive correlation between the proportion of Luxembourgers and percentage of population with hearing disability in the United States with a correlation coefficient (R) of 0.091 and weighted average of 3.2%. Similarly, the statistical analysis conducted on geographies consisting of 24,680,511 people shows a substantial positive correlation between the proportion of Hmong and percentage of population with hearing disability in the United States with a correlation coefficient (R) of 0.531 and weighted average of 3.4%, a difference of 5.8%.
Hearing Disability Correlation Summary
| Measurement | Luxembourger | Hmong |
| Minimum | 0.78% | 1.9% |
| Maximum | 8.6% | 8.3% |
| Range | 7.9% | 6.5% |
| Mean | 4.0% | 3.7% |
| Median | 3.5% | 3.3% |
| Interquartile 25% (IQ1) | 2.9% | 2.6% |
| Interquartile 75% (IQ3) | 4.9% | 4.5% |
| Interquartile Range (IQR) | 1.9% | 1.8% |
| Standard Deviation (Sample) | 1.6% | 1.5% |
| Standard Deviation (Population) | 1.6% | 1.4% |
Similar Demographics by Hearing Disability
Demographics Similar to Luxembourgers by Hearing Disability
In terms of hearing disability, the demographic groups most similar to Luxembourgers are Ukrainian (3.2%, a difference of 0.050%), Greek (3.2%, a difference of 0.23%), Estonian (3.3%, a difference of 0.42%), Central American Indian (3.3%, a difference of 0.49%), and Guamanian/Chamorro (3.3%, a difference of 0.60%).
| Demographics | Rating | Rank | Hearing Disability |
| Icelanders | 5.2 /100 | #224 | Tragic 3.2% |
| Latvians | 5.1 /100 | #225 | Tragic 3.2% |
| Lebanese | 5.0 /100 | #226 | Tragic 3.2% |
| Bhutanese | 4.6 /100 | #227 | Tragic 3.2% |
| Immigrants | Portugal | 4.3 /100 | #228 | Tragic 3.2% |
| Maltese | 4.1 /100 | #229 | Tragic 3.2% |
| Greeks | 3.2 /100 | #230 | Tragic 3.2% |
| Luxembourgers | 2.9 /100 | #231 | Tragic 3.2% |
| Ukrainians | 2.9 /100 | #232 | Tragic 3.2% |
| Estonians | 2.4 /100 | #233 | Tragic 3.3% |
| Central American Indians | 2.3 /100 | #234 | Tragic 3.3% |
| Guamanians/Chamorros | 2.2 /100 | #235 | Tragic 3.3% |
| Serbians | 2.2 /100 | #236 | Tragic 3.3% |
| Immigrants | Austria | 1.8 /100 | #237 | Tragic 3.3% |
| German Russians | 1.8 /100 | #238 | Tragic 3.3% |
Demographics Similar to Hmong by Hearing Disability
In terms of hearing disability, the demographic groups most similar to Hmong are Polish (3.4%, a difference of 0.040%), Slavic (3.4%, a difference of 0.27%), Yaqui (3.4%, a difference of 0.45%), Northern European (3.4%, a difference of 0.52%), and Carpatho Rusyn (3.4%, a difference of 0.70%).
| Demographics | Rating | Rank | Hearing Disability |
| Italians | 0.4 /100 | #249 | Tragic 3.4% |
| Yuman | 0.4 /100 | #250 | Tragic 3.4% |
| Hungarians | 0.4 /100 | #251 | Tragic 3.4% |
| Croatians | 0.4 /100 | #252 | Tragic 3.4% |
| Carpatho Rusyns | 0.3 /100 | #253 | Tragic 3.4% |
| Slavs | 0.2 /100 | #254 | Tragic 3.4% |
| Poles | 0.2 /100 | #255 | Tragic 3.4% |
| Hmong | 0.2 /100 | #256 | Tragic 3.4% |
| Yaqui | 0.2 /100 | #257 | Tragic 3.4% |
| Northern Europeans | 0.2 /100 | #258 | Tragic 3.4% |
| Slovenes | 0.1 /100 | #259 | Tragic 3.5% |
| Portuguese | 0.1 /100 | #260 | Tragic 3.5% |
| Hawaiians | 0.1 /100 | #261 | Tragic 3.5% |
| Immigrants | North America | 0.1 /100 | #262 | Tragic 3.5% |
| Immigrants | Canada | 0.1 /100 | #263 | Tragic 3.5% |