Luxembourger vs Fijian Hearing Disability
COMPARE
Luxembourger
Fijian
Hearing Disability
Hearing Disability Comparison
Luxembourgers
Fijians
3.2%
HEARING DISABILITY
2.9/ 100
METRIC RATING
231st/ 347
METRIC RANK
3.5%
HEARING DISABILITY
0.0/ 100
METRIC RATING
272nd/ 347
METRIC RANK
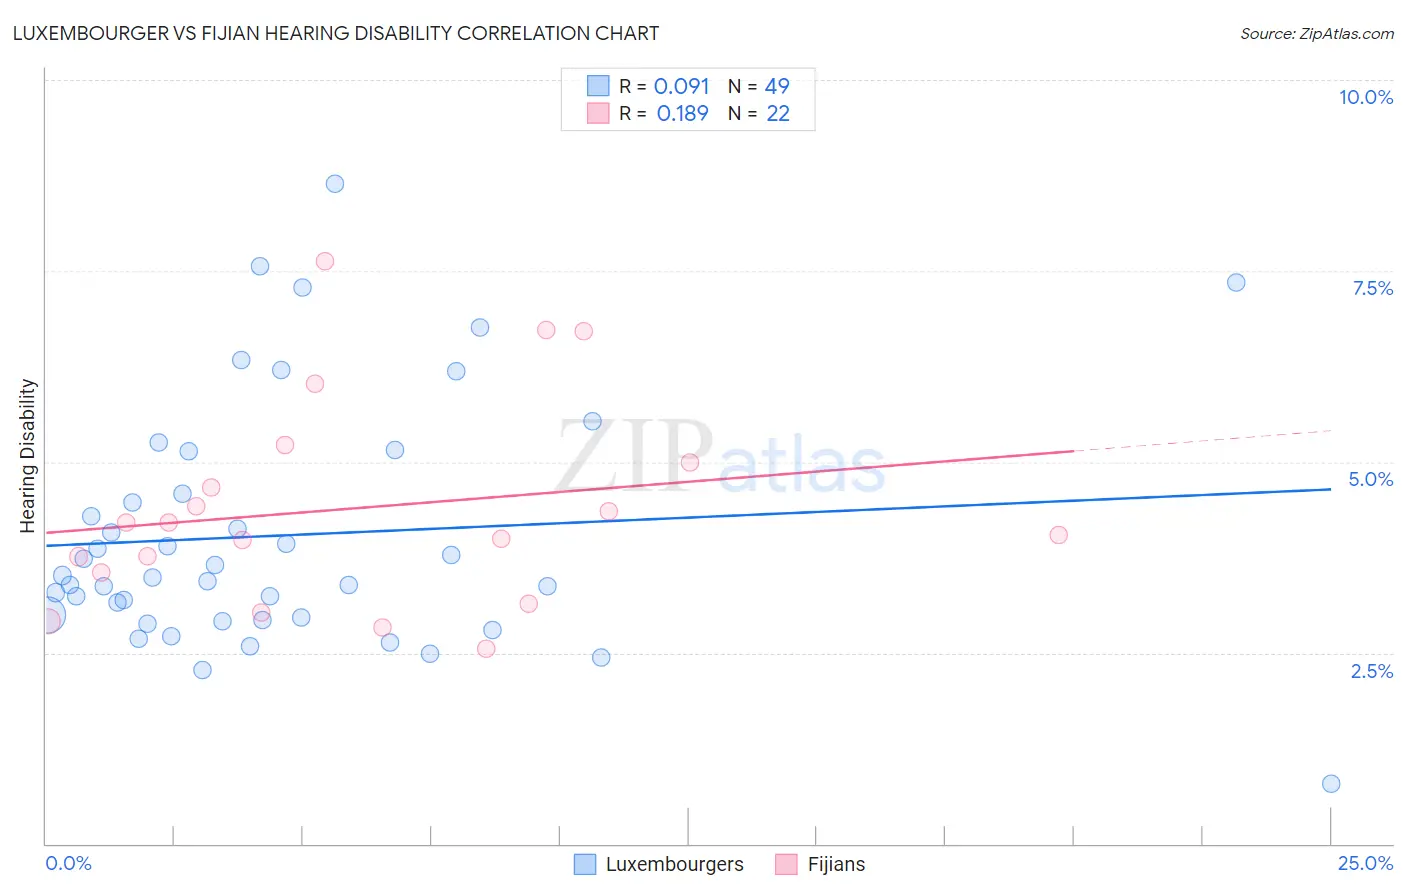
Luxembourger vs Fijian Hearing Disability Correlation Chart
The statistical analysis conducted on geographies consisting of 144,678,787 people shows a slight positive correlation between the proportion of Luxembourgers and percentage of population with hearing disability in the United States with a correlation coefficient (R) of 0.091 and weighted average of 3.2%. Similarly, the statistical analysis conducted on geographies consisting of 55,946,313 people shows a poor positive correlation between the proportion of Fijians and percentage of population with hearing disability in the United States with a correlation coefficient (R) of 0.189 and weighted average of 3.5%, a difference of 8.9%.
Hearing Disability Correlation Summary
| Measurement | Luxembourger | Fijian |
| Minimum | 0.78% | 2.5% |
| Maximum | 8.6% | 7.6% |
| Range | 7.9% | 5.1% |
| Mean | 4.0% | 4.4% |
| Median | 3.5% | 4.1% |
| Interquartile 25% (IQ1) | 2.9% | 3.6% |
| Interquartile 75% (IQ3) | 4.9% | 5.0% |
| Interquartile Range (IQR) | 1.9% | 1.4% |
| Standard Deviation (Sample) | 1.6% | 1.4% |
| Standard Deviation (Population) | 1.6% | 1.3% |
Similar Demographics by Hearing Disability
Demographics Similar to Luxembourgers by Hearing Disability
In terms of hearing disability, the demographic groups most similar to Luxembourgers are Ukrainian (3.2%, a difference of 0.050%), Greek (3.2%, a difference of 0.23%), Estonian (3.3%, a difference of 0.42%), Central American Indian (3.3%, a difference of 0.49%), and Guamanian/Chamorro (3.3%, a difference of 0.60%).
| Demographics | Rating | Rank | Hearing Disability |
| Icelanders | 5.2 /100 | #224 | Tragic 3.2% |
| Latvians | 5.1 /100 | #225 | Tragic 3.2% |
| Lebanese | 5.0 /100 | #226 | Tragic 3.2% |
| Bhutanese | 4.6 /100 | #227 | Tragic 3.2% |
| Immigrants | Portugal | 4.3 /100 | #228 | Tragic 3.2% |
| Maltese | 4.1 /100 | #229 | Tragic 3.2% |
| Greeks | 3.2 /100 | #230 | Tragic 3.2% |
| Luxembourgers | 2.9 /100 | #231 | Tragic 3.2% |
| Ukrainians | 2.9 /100 | #232 | Tragic 3.2% |
| Estonians | 2.4 /100 | #233 | Tragic 3.3% |
| Central American Indians | 2.3 /100 | #234 | Tragic 3.3% |
| Guamanians/Chamorros | 2.2 /100 | #235 | Tragic 3.3% |
| Serbians | 2.2 /100 | #236 | Tragic 3.3% |
| Immigrants | Austria | 1.8 /100 | #237 | Tragic 3.3% |
| German Russians | 1.8 /100 | #238 | Tragic 3.3% |
Demographics Similar to Fijians by Hearing Disability
In terms of hearing disability, the demographic groups most similar to Fijians are Puerto Rican (3.5%, a difference of 0.070%), Czech (3.5%, a difference of 0.26%), Swiss (3.5%, a difference of 0.39%), European (3.5%, a difference of 0.52%), and Czechoslovakian (3.6%, a difference of 0.60%).
| Demographics | Rating | Rank | Hearing Disability |
| British | 0.1 /100 | #265 | Tragic 3.5% |
| Belgians | 0.1 /100 | #266 | Tragic 3.5% |
| Canadians | 0.1 /100 | #267 | Tragic 3.5% |
| Spaniards | 0.1 /100 | #268 | Tragic 3.5% |
| Ute | 0.1 /100 | #269 | Tragic 3.5% |
| Europeans | 0.1 /100 | #270 | Tragic 3.5% |
| Czechs | 0.1 /100 | #271 | Tragic 3.5% |
| Fijians | 0.0 /100 | #272 | Tragic 3.5% |
| Puerto Ricans | 0.0 /100 | #273 | Tragic 3.5% |
| Swiss | 0.0 /100 | #274 | Tragic 3.5% |
| Czechoslovakians | 0.0 /100 | #275 | Tragic 3.6% |
| Danes | 0.0 /100 | #276 | Tragic 3.6% |
| Immigrants | Nonimmigrants | 0.0 /100 | #277 | Tragic 3.6% |
| Basques | 0.0 /100 | #278 | Tragic 3.6% |
| Slovaks | 0.0 /100 | #279 | Tragic 3.6% |