Central American vs Guamanian/Chamorro Disability Age Under 5
COMPARE
Central American
Guamanian/Chamorro
Disability Age Under 5
Disability Age Under 5 Comparison
Central Americans
Guamanians/Chamorros
1.2%
DISABILITY AGE UNDER 5
89.7/ 100
METRIC RATING
126th/ 347
METRIC RANK
1.2%
DISABILITY AGE UNDER 5
57.8/ 100
METRIC RATING
171st/ 347
METRIC RANK
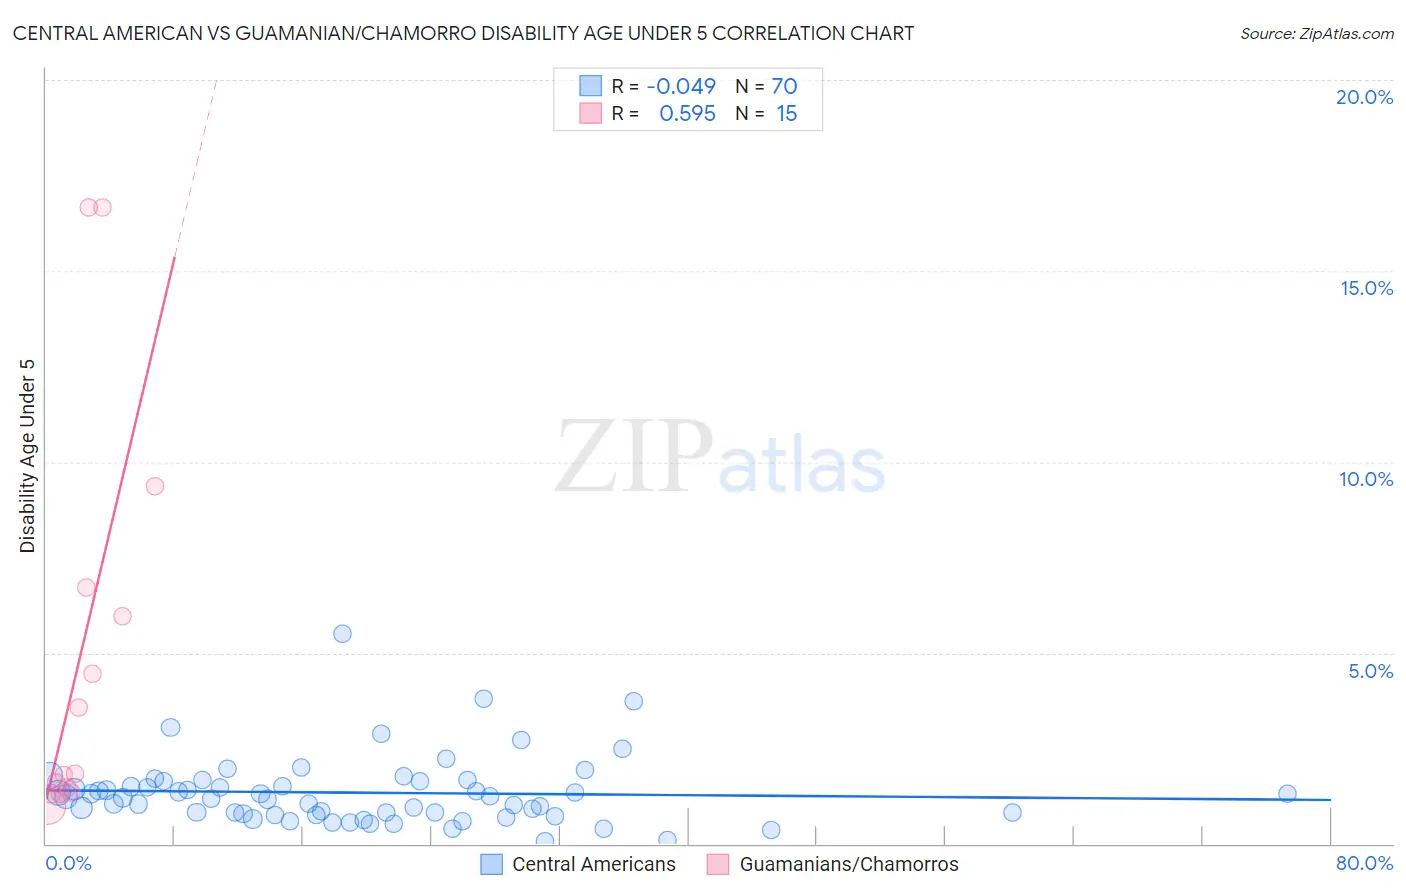
Central American vs Guamanian/Chamorro Disability Age Under 5 Correlation Chart
The statistical analysis conducted on geographies consisting of 251,619,686 people shows no correlation between the proportion of Central Americans and percentage of population with a disability under the age of 5 in the United States with a correlation coefficient (R) of -0.049 and weighted average of 1.2%. Similarly, the statistical analysis conducted on geographies consisting of 149,028,768 people shows a substantial positive correlation between the proportion of Guamanians/Chamorros and percentage of population with a disability under the age of 5 in the United States with a correlation coefficient (R) of 0.595 and weighted average of 1.2%, a difference of 4.4%.
Disability Age Under 5 Correlation Summary
| Measurement | Central American | Guamanian/Chamorro |
| Minimum | 0.078% | 0.97% |
| Maximum | 5.5% | 16.7% |
| Range | 5.4% | 15.7% |
| Mean | 1.3% | 5.0% |
| Median | 1.2% | 1.8% |
| Interquartile 25% (IQ1) | 0.79% | 1.4% |
| Interquartile 75% (IQ3) | 1.6% | 6.7% |
| Interquartile Range (IQR) | 0.84% | 5.3% |
| Standard Deviation (Sample) | 0.90% | 5.3% |
| Standard Deviation (Population) | 0.89% | 5.2% |
Similar Demographics by Disability Age Under 5
Demographics Similar to Central Americans by Disability Age Under 5
In terms of disability age under 5, the demographic groups most similar to Central Americans are Japanese (1.2%, a difference of 0.16%), Immigrants from Cambodia (1.2%, a difference of 0.22%), Zimbabwean (1.2%, a difference of 0.25%), Aleut (1.2%, a difference of 0.29%), and Immigrants from Romania (1.2%, a difference of 0.30%).
| Demographics | Rating | Rank | Disability Age Under 5 |
| Bhutanese | 92.5 /100 | #119 | Exceptional 1.2% |
| Immigrants | Eritrea | 92.3 /100 | #120 | Exceptional 1.2% |
| Immigrants | Senegal | 91.4 /100 | #121 | Exceptional 1.2% |
| Aleuts | 90.7 /100 | #122 | Exceptional 1.2% |
| Zimbabweans | 90.6 /100 | #123 | Exceptional 1.2% |
| Immigrants | Cambodia | 90.5 /100 | #124 | Exceptional 1.2% |
| Japanese | 90.3 /100 | #125 | Exceptional 1.2% |
| Central Americans | 89.7 /100 | #126 | Excellent 1.2% |
| Immigrants | Romania | 88.4 /100 | #127 | Excellent 1.2% |
| Immigrants | France | 88.4 /100 | #128 | Excellent 1.2% |
| Immigrants | Immigrants | 88.0 /100 | #129 | Excellent 1.2% |
| Koreans | 87.7 /100 | #130 | Excellent 1.2% |
| Immigrants | Serbia | 87.6 /100 | #131 | Excellent 1.2% |
| Immigrants | Eastern Europe | 87.3 /100 | #132 | Excellent 1.2% |
| Immigrants | Spain | 86.5 /100 | #133 | Excellent 1.2% |
Demographics Similar to Guamanians/Chamorros by Disability Age Under 5
In terms of disability age under 5, the demographic groups most similar to Guamanians/Chamorros are Immigrants from Jamaica (1.2%, a difference of 0.090%), Immigrants from Uruguay (1.2%, a difference of 0.11%), Sierra Leonean (1.2%, a difference of 0.12%), Immigrants from Argentina (1.2%, a difference of 0.23%), and Immigrants from Central America (1.2%, a difference of 0.34%).
| Demographics | Rating | Rank | Disability Age Under 5 |
| Laotians | 62.8 /100 | #164 | Good 1.2% |
| Immigrants | Kuwait | 62.6 /100 | #165 | Good 1.2% |
| Immigrants | Central America | 61.4 /100 | #166 | Good 1.2% |
| Immigrants | Argentina | 60.2 /100 | #167 | Good 1.2% |
| Sierra Leoneans | 59.1 /100 | #168 | Average 1.2% |
| Immigrants | Uruguay | 59.0 /100 | #169 | Average 1.2% |
| Immigrants | Jamaica | 58.8 /100 | #170 | Average 1.2% |
| Guamanians/Chamorros | 57.8 /100 | #171 | Average 1.2% |
| Crow | 51.0 /100 | #172 | Average 1.2% |
| Immigrants | Ireland | 50.3 /100 | #173 | Average 1.2% |
| Immigrants | Latvia | 50.0 /100 | #174 | Average 1.2% |
| Immigrants | Nigeria | 50.0 /100 | #175 | Average 1.2% |
| Immigrants | Kenya | 48.6 /100 | #176 | Average 1.2% |
| Comanche | 47.5 /100 | #177 | Average 1.2% |
| Venezuelans | 47.1 /100 | #178 | Average 1.2% |