Lumbee vs Greek 8th Grade
COMPARE
Lumbee
Greek
8th Grade
8th Grade Comparison
Lumbee
Greeks
96.0%
8TH GRADE
84.1/ 100
METRIC RATING
145th/ 347
METRIC RANK
96.8%
8TH GRADE
99.9/ 100
METRIC RATING
52nd/ 347
METRIC RANK
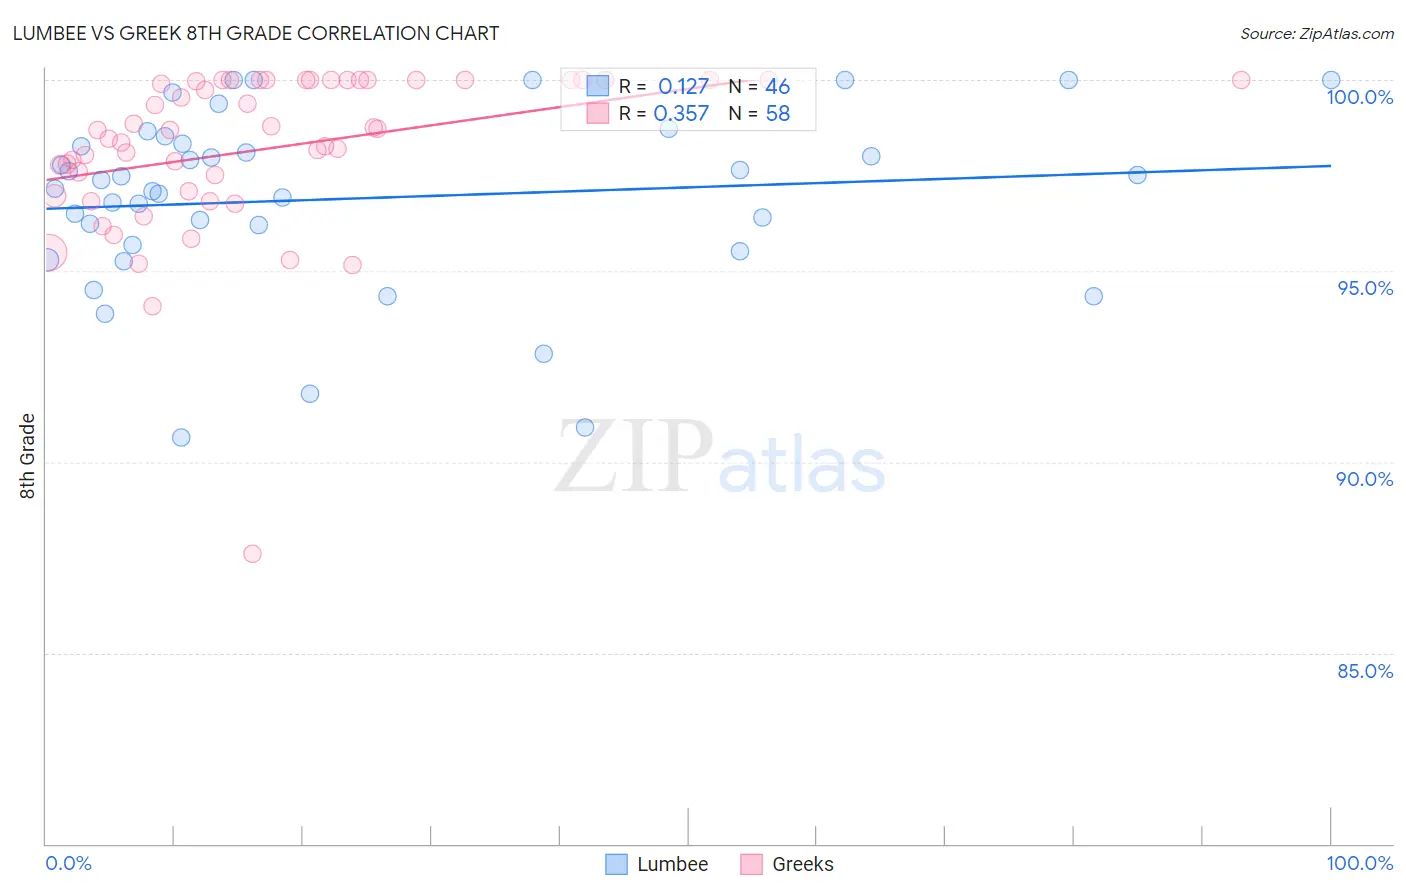
Lumbee vs Greek 8th Grade Correlation Chart
The statistical analysis conducted on geographies consisting of 92,298,865 people shows a poor positive correlation between the proportion of Lumbee and percentage of population with at least 8th grade education in the United States with a correlation coefficient (R) of 0.127 and weighted average of 96.0%. Similarly, the statistical analysis conducted on geographies consisting of 482,775,358 people shows a mild positive correlation between the proportion of Greeks and percentage of population with at least 8th grade education in the United States with a correlation coefficient (R) of 0.357 and weighted average of 96.8%, a difference of 0.80%.
8th Grade Correlation Summary
| Measurement | Lumbee | Greek |
| Minimum | 90.6% | 87.6% |
| Maximum | 100.0% | 100.0% |
| Range | 9.4% | 12.4% |
| Mean | 96.9% | 98.2% |
| Median | 97.3% | 98.7% |
| Interquartile 25% (IQ1) | 95.7% | 97.1% |
| Interquartile 75% (IQ3) | 98.3% | 100.0% |
| Interquartile Range (IQR) | 2.6% | 2.9% |
| Standard Deviation (Sample) | 2.3% | 2.2% |
| Standard Deviation (Population) | 2.3% | 2.1% |
Similar Demographics by 8th Grade
Demographics Similar to Lumbee by 8th Grade
In terms of 8th grade, the demographic groups most similar to Lumbee are Israeli (96.0%, a difference of 0.0%), Colville (96.0%, a difference of 0.0%), Spanish (96.0%, a difference of 0.010%), Immigrants from Belarus (96.0%, a difference of 0.010%), and Albanian (96.0%, a difference of 0.010%).
| Demographics | Rating | Rank | 8th Grade |
| Burmese | 90.2 /100 | #138 | Exceptional 96.1% |
| Hmong | 89.7 /100 | #139 | Excellent 96.1% |
| Immigrants | South Central Asia | 89.4 /100 | #140 | Excellent 96.1% |
| Immigrants | Greece | 85.9 /100 | #141 | Excellent 96.0% |
| Immigrants | Eastern Europe | 85.4 /100 | #142 | Excellent 96.0% |
| Spanish | 85.1 /100 | #143 | Excellent 96.0% |
| Immigrants | Belarus | 84.8 /100 | #144 | Excellent 96.0% |
| Lumbee | 84.1 /100 | #145 | Excellent 96.0% |
| Israelis | 84.1 /100 | #146 | Excellent 96.0% |
| Colville | 84.0 /100 | #147 | Excellent 96.0% |
| Albanians | 83.1 /100 | #148 | Excellent 96.0% |
| Immigrants | Israel | 81.3 /100 | #149 | Excellent 96.0% |
| Immigrants | Russia | 80.9 /100 | #150 | Excellent 96.0% |
| Blackfeet | 80.8 /100 | #151 | Excellent 96.0% |
| French American Indians | 80.6 /100 | #152 | Excellent 96.0% |
Demographics Similar to Greeks by 8th Grade
In terms of 8th grade, the demographic groups most similar to Greeks are Austrian (96.7%, a difference of 0.020%), Serbian (96.7%, a difference of 0.020%), Celtic (96.8%, a difference of 0.030%), Russian (96.7%, a difference of 0.030%), and Australian (96.7%, a difference of 0.030%).
| Demographics | Rating | Rank | 8th Grade |
| Northern Europeans | 99.9 /100 | #45 | Exceptional 96.9% |
| Czechoslovakians | 99.9 /100 | #46 | Exceptional 96.9% |
| Bulgarians | 99.9 /100 | #47 | Exceptional 96.9% |
| Slavs | 99.9 /100 | #48 | Exceptional 96.8% |
| Estonians | 99.9 /100 | #49 | Exceptional 96.8% |
| Immigrants | Scotland | 99.9 /100 | #50 | Exceptional 96.8% |
| Celtics | 99.9 /100 | #51 | Exceptional 96.8% |
| Greeks | 99.9 /100 | #52 | Exceptional 96.8% |
| Austrians | 99.9 /100 | #53 | Exceptional 96.7% |
| Serbians | 99.8 /100 | #54 | Exceptional 96.7% |
| Russians | 99.8 /100 | #55 | Exceptional 96.7% |
| Australians | 99.8 /100 | #56 | Exceptional 96.7% |
| Macedonians | 99.8 /100 | #57 | Exceptional 96.7% |
| Immigrants | Canada | 99.8 /100 | #58 | Exceptional 96.7% |
| Immigrants | North America | 99.8 /100 | #59 | Exceptional 96.7% |