Immigrants from Morocco vs Mexican Ambulatory Disability
COMPARE
Immigrants from Morocco
Mexican
Ambulatory Disability
Ambulatory Disability Comparison
Immigrants from Morocco
Mexicans
5.8%
AMBULATORY DISABILITY
97.3/ 100
METRIC RATING
106th/ 347
METRIC RANK
6.4%
AMBULATORY DISABILITY
3.5/ 100
METRIC RATING
230th/ 347
METRIC RANK
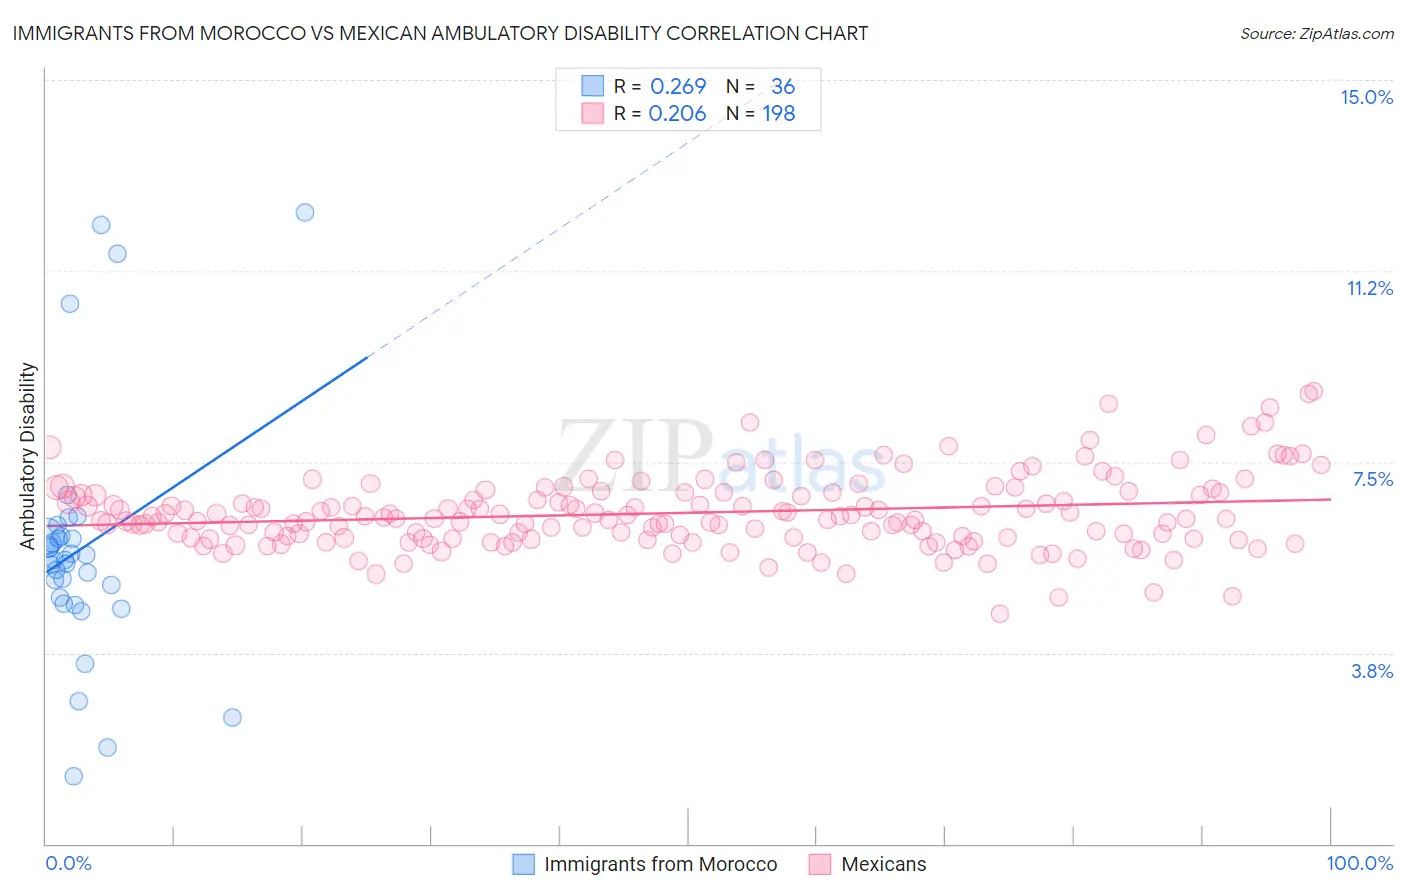
Immigrants from Morocco vs Mexican Ambulatory Disability Correlation Chart
The statistical analysis conducted on geographies consisting of 178,910,370 people shows a weak positive correlation between the proportion of Immigrants from Morocco and percentage of population with ambulatory disability in the United States with a correlation coefficient (R) of 0.269 and weighted average of 5.8%. Similarly, the statistical analysis conducted on geographies consisting of 564,662,817 people shows a weak positive correlation between the proportion of Mexicans and percentage of population with ambulatory disability in the United States with a correlation coefficient (R) of 0.206 and weighted average of 6.4%, a difference of 9.6%.
Ambulatory Disability Correlation Summary
| Measurement | Immigrants from Morocco | Mexican |
| Minimum | 1.3% | 4.5% |
| Maximum | 12.4% | 8.9% |
| Range | 11.1% | 4.4% |
| Mean | 5.8% | 6.5% |
| Median | 5.6% | 6.4% |
| Interquartile 25% (IQ1) | 4.8% | 6.0% |
| Interquartile 75% (IQ3) | 6.0% | 6.9% |
| Interquartile Range (IQR) | 1.3% | 0.88% |
| Standard Deviation (Sample) | 2.5% | 0.72% |
| Standard Deviation (Population) | 2.4% | 0.72% |
Similar Demographics by Ambulatory Disability
Demographics Similar to Immigrants from Morocco by Ambulatory Disability
In terms of ambulatory disability, the demographic groups most similar to Immigrants from Morocco are Uruguayan (5.8%, a difference of 0.050%), Immigrants from Czechoslovakia (5.8%, a difference of 0.070%), Colombian (5.8%, a difference of 0.070%), Immigrants from Netherlands (5.8%, a difference of 0.080%), and New Zealander (5.8%, a difference of 0.18%).
| Demographics | Rating | Rank | Ambulatory Disability |
| Immigrants | Northern Europe | 98.2 /100 | #99 | Exceptional 5.8% |
| Immigrants | Serbia | 97.9 /100 | #100 | Exceptional 5.8% |
| Immigrants | South America | 97.9 /100 | #101 | Exceptional 5.8% |
| Immigrants | Kenya | 97.8 /100 | #102 | Exceptional 5.8% |
| Immigrants | Romania | 97.7 /100 | #103 | Exceptional 5.8% |
| New Zealanders | 97.6 /100 | #104 | Exceptional 5.8% |
| Immigrants | Czechoslovakia | 97.4 /100 | #105 | Exceptional 5.8% |
| Immigrants | Morocco | 97.3 /100 | #106 | Exceptional 5.8% |
| Uruguayans | 97.2 /100 | #107 | Exceptional 5.8% |
| Colombians | 97.2 /100 | #108 | Exceptional 5.8% |
| Immigrants | Netherlands | 97.1 /100 | #109 | Exceptional 5.8% |
| Immigrants | Colombia | 96.7 /100 | #110 | Exceptional 5.8% |
| Danes | 96.6 /100 | #111 | Exceptional 5.8% |
| South Africans | 96.3 /100 | #112 | Exceptional 5.9% |
| Immigrants | Uruguay | 95.6 /100 | #113 | Exceptional 5.9% |
Demographics Similar to Mexicans by Ambulatory Disability
In terms of ambulatory disability, the demographic groups most similar to Mexicans are Czechoslovakian (6.4%, a difference of 0.11%), Portuguese (6.4%, a difference of 0.15%), Panamanian (6.4%, a difference of 0.16%), Cuban (6.4%, a difference of 0.17%), and Slavic (6.4%, a difference of 0.49%).
| Demographics | Rating | Rank | Ambulatory Disability |
| Immigrants | Honduras | 7.6 /100 | #223 | Tragic 6.3% |
| Liberians | 7.1 /100 | #224 | Tragic 6.3% |
| Hondurans | 6.3 /100 | #225 | Tragic 6.3% |
| Slavs | 5.1 /100 | #226 | Tragic 6.4% |
| Cubans | 4.0 /100 | #227 | Tragic 6.4% |
| Portuguese | 4.0 /100 | #228 | Tragic 6.4% |
| Czechoslovakians | 3.8 /100 | #229 | Tragic 6.4% |
| Mexicans | 3.5 /100 | #230 | Tragic 6.4% |
| Panamanians | 3.1 /100 | #231 | Tragic 6.4% |
| Assyrians/Chaldeans/Syriacs | 2.4 /100 | #232 | Tragic 6.4% |
| Sub-Saharan Africans | 2.3 /100 | #233 | Tragic 6.4% |
| Immigrants | Liberia | 2.3 /100 | #234 | Tragic 6.4% |
| Hispanics or Latinos | 2.2 /100 | #235 | Tragic 6.4% |
| Dutch | 2.0 /100 | #236 | Tragic 6.4% |
| Immigrants | Germany | 1.8 /100 | #237 | Tragic 6.4% |