Liberian vs Navajo Vision Disability
COMPARE
Liberian
Navajo
Vision Disability
Vision Disability Comparison
Liberians
Navajo
2.3%
VISION DISABILITY
0.5/ 100
METRIC RATING
249th/ 347
METRIC RANK
3.1%
VISION DISABILITY
0.0/ 100
METRIC RATING
335th/ 347
METRIC RANK
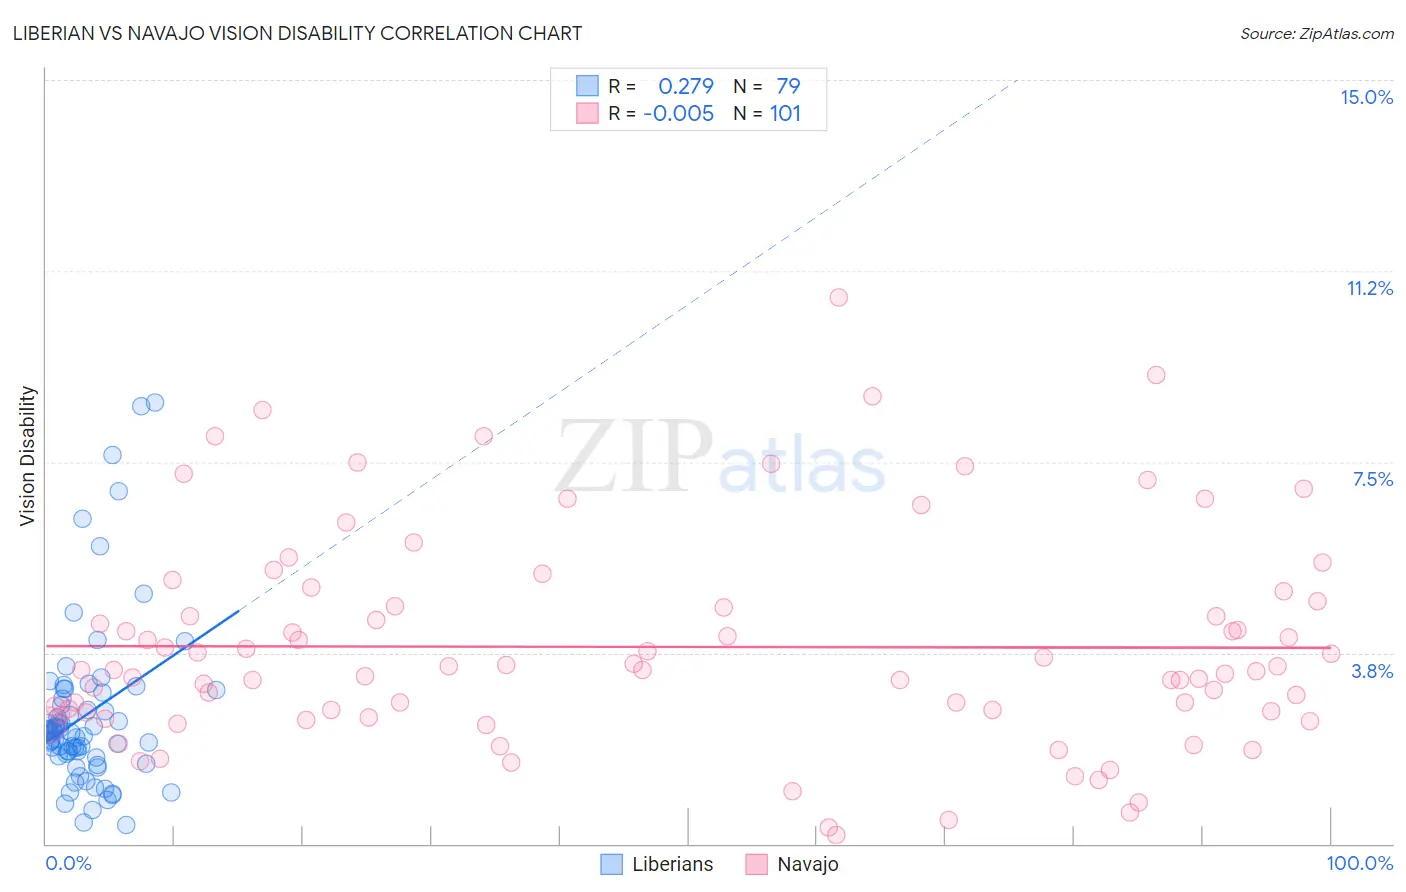
Liberian vs Navajo Vision Disability Correlation Chart
The statistical analysis conducted on geographies consisting of 118,074,683 people shows a weak positive correlation between the proportion of Liberians and percentage of population with vision disability in the United States with a correlation coefficient (R) of 0.279 and weighted average of 2.3%. Similarly, the statistical analysis conducted on geographies consisting of 224,647,940 people shows no correlation between the proportion of Navajo and percentage of population with vision disability in the United States with a correlation coefficient (R) of -0.005 and weighted average of 3.1%, a difference of 34.0%.
Vision Disability Correlation Summary
| Measurement | Liberian | Navajo |
| Minimum | 0.37% | 0.16% |
| Maximum | 8.7% | 10.7% |
| Range | 8.3% | 10.6% |
| Mean | 2.5% | 3.9% |
| Median | 2.2% | 3.4% |
| Interquartile 25% (IQ1) | 1.7% | 2.6% |
| Interquartile 75% (IQ3) | 3.0% | 4.7% |
| Interquartile Range (IQR) | 1.3% | 2.2% |
| Standard Deviation (Sample) | 1.7% | 2.1% |
| Standard Deviation (Population) | 1.6% | 2.1% |
Similar Demographics by Vision Disability
Demographics Similar to Liberians by Vision Disability
In terms of vision disability, the demographic groups most similar to Liberians are Subsaharan African (2.3%, a difference of 0.010%), Guatemalan (2.3%, a difference of 0.030%), French (2.3%, a difference of 0.070%), Bangladeshi (2.3%, a difference of 0.080%), and Immigrants from Laos (2.4%, a difference of 0.19%).
| Demographics | Rating | Rank | Vision Disability |
| Immigrants | Panama | 0.8 /100 | #242 | Tragic 2.3% |
| Immigrants | Nicaragua | 0.6 /100 | #243 | Tragic 2.3% |
| Immigrants | West Indies | 0.6 /100 | #244 | Tragic 2.3% |
| Alsatians | 0.6 /100 | #245 | Tragic 2.3% |
| French | 0.5 /100 | #246 | Tragic 2.3% |
| Guatemalans | 0.5 /100 | #247 | Tragic 2.3% |
| Sub-Saharan Africans | 0.5 /100 | #248 | Tragic 2.3% |
| Liberians | 0.5 /100 | #249 | Tragic 2.3% |
| Bangladeshis | 0.5 /100 | #250 | Tragic 2.3% |
| Immigrants | Laos | 0.4 /100 | #251 | Tragic 2.4% |
| Immigrants | Micronesia | 0.3 /100 | #252 | Tragic 2.4% |
| Japanese | 0.3 /100 | #253 | Tragic 2.4% |
| Haitians | 0.3 /100 | #254 | Tragic 2.4% |
| Immigrants | Guatemala | 0.3 /100 | #255 | Tragic 2.4% |
| Immigrants | Haiti | 0.2 /100 | #256 | Tragic 2.4% |
Demographics Similar to Navajo by Vision Disability
In terms of vision disability, the demographic groups most similar to Navajo are Alaskan Athabascan (3.1%, a difference of 0.16%), Dutch West Indian (3.2%, a difference of 0.19%), Chickasaw (3.2%, a difference of 1.1%), Cheyenne (3.1%, a difference of 1.7%), and Tsimshian (3.2%, a difference of 1.8%).
| Demographics | Rating | Rank | Vision Disability |
| Yuman | 0.0 /100 | #328 | Tragic 3.0% |
| Apache | 0.0 /100 | #329 | Tragic 3.0% |
| Colville | 0.0 /100 | #330 | Tragic 3.0% |
| Central American Indians | 0.0 /100 | #331 | Tragic 3.0% |
| Seminole | 0.0 /100 | #332 | Tragic 3.1% |
| Cajuns | 0.0 /100 | #333 | Tragic 3.1% |
| Cheyenne | 0.0 /100 | #334 | Tragic 3.1% |
| Navajo | 0.0 /100 | #335 | Tragic 3.1% |
| Alaskan Athabascans | 0.0 /100 | #336 | Tragic 3.1% |
| Dutch West Indians | 0.0 /100 | #337 | Tragic 3.2% |
| Chickasaw | 0.0 /100 | #338 | Tragic 3.2% |
| Tsimshian | 0.0 /100 | #339 | Tragic 3.2% |
| Creek | 0.0 /100 | #340 | Tragic 3.2% |
| Kiowa | 0.0 /100 | #341 | Tragic 3.3% |
| Choctaw | 0.0 /100 | #342 | Tragic 3.3% |