Liberian vs Bhutanese Seniors Poverty Over the Age of 65
COMPARE
Liberian
Bhutanese
Seniors Poverty Over the Age of 65
Seniors Poverty Over the Age of 65 Comparison
Liberians
Bhutanese
11.8%
SENIORS POVERTY OVER THE AGE OF 65
3.2/ 100
METRIC RATING
226th/ 347
METRIC RANK
9.3%
SENIORS POVERTY OVER THE AGE OF 65
99.9/ 100
METRIC RATING
29th/ 347
METRIC RANK
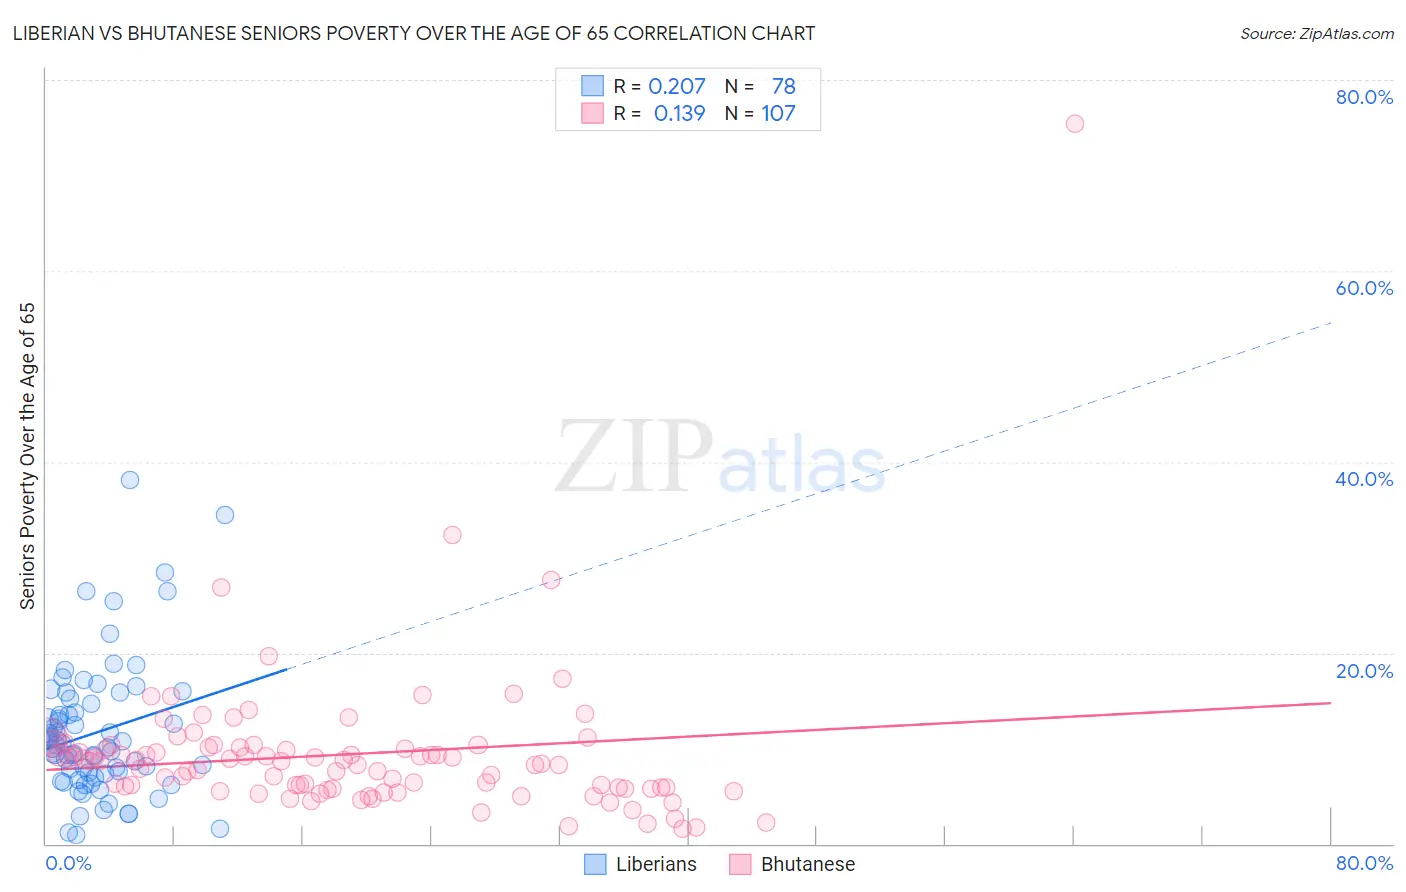
Liberian vs Bhutanese Seniors Poverty Over the Age of 65 Correlation Chart
The statistical analysis conducted on geographies consisting of 117,906,609 people shows a weak positive correlation between the proportion of Liberians and poverty level among seniors over the age of 65 in the United States with a correlation coefficient (R) of 0.207 and weighted average of 11.8%. Similarly, the statistical analysis conducted on geographies consisting of 453,130,109 people shows a poor positive correlation between the proportion of Bhutanese and poverty level among seniors over the age of 65 in the United States with a correlation coefficient (R) of 0.139 and weighted average of 9.3%, a difference of 25.9%.
Seniors Poverty Over the Age of 65 Correlation Summary
| Measurement | Liberian | Bhutanese |
| Minimum | 0.95% | 1.5% |
| Maximum | 38.1% | 75.4% |
| Range | 37.1% | 73.9% |
| Mean | 11.6% | 9.4% |
| Median | 10.2% | 8.6% |
| Interquartile 25% (IQ1) | 7.3% | 5.8% |
| Interquartile 75% (IQ3) | 14.7% | 10.1% |
| Interquartile Range (IQR) | 7.4% | 4.3% |
| Standard Deviation (Sample) | 7.0% | 8.1% |
| Standard Deviation (Population) | 7.0% | 8.0% |
Similar Demographics by Seniors Poverty Over the Age of 65
Demographics Similar to Liberians by Seniors Poverty Over the Age of 65
In terms of seniors poverty over the age of 65, the demographic groups most similar to Liberians are Immigrants from Belarus (11.8%, a difference of 0.020%), Nigerian (11.8%, a difference of 0.030%), Immigrants from Nigeria (11.7%, a difference of 0.12%), Immigrants from Congo (11.7%, a difference of 0.36%), and Immigrants from Costa Rica (11.8%, a difference of 0.36%).
| Demographics | Rating | Rank | Seniors Poverty Over the Age of 65 |
| Arapaho | 5.2 /100 | #219 | Tragic 11.6% |
| Peruvians | 4.2 /100 | #220 | Tragic 11.7% |
| Argentineans | 4.1 /100 | #221 | Tragic 11.7% |
| Immigrants | Chile | 3.9 /100 | #222 | Tragic 11.7% |
| Immigrants | Congo | 3.8 /100 | #223 | Tragic 11.7% |
| Immigrants | Nigeria | 3.4 /100 | #224 | Tragic 11.7% |
| Immigrants | Belarus | 3.2 /100 | #225 | Tragic 11.8% |
| Liberians | 3.2 /100 | #226 | Tragic 11.8% |
| Nigerians | 3.2 /100 | #227 | Tragic 11.8% |
| Immigrants | Costa Rica | 2.7 /100 | #228 | Tragic 11.8% |
| Immigrants | Eritrea | 2.6 /100 | #229 | Tragic 11.8% |
| Bermudans | 2.1 /100 | #230 | Tragic 11.9% |
| Cajuns | 2.0 /100 | #231 | Tragic 11.9% |
| Yaqui | 1.9 /100 | #232 | Tragic 11.9% |
| Panamanians | 1.8 /100 | #233 | Tragic 11.9% |
Demographics Similar to Bhutanese by Seniors Poverty Over the Age of 65
In terms of seniors poverty over the age of 65, the demographic groups most similar to Bhutanese are Menominee (9.4%, a difference of 0.15%), Tongan (9.3%, a difference of 0.32%), Finnish (9.4%, a difference of 0.37%), Italian (9.3%, a difference of 0.52%), and Immigrants from Scotland (9.3%, a difference of 0.60%).
| Demographics | Rating | Rank | Seniors Poverty Over the Age of 65 |
| Slovenes | 99.9 /100 | #22 | Exceptional 9.3% |
| Welsh | 99.9 /100 | #23 | Exceptional 9.3% |
| Bulgarians | 99.9 /100 | #24 | Exceptional 9.3% |
| Irish | 99.9 /100 | #25 | Exceptional 9.3% |
| Immigrants | Scotland | 99.9 /100 | #26 | Exceptional 9.3% |
| Italians | 99.9 /100 | #27 | Exceptional 9.3% |
| Tongans | 99.9 /100 | #28 | Exceptional 9.3% |
| Bhutanese | 99.9 /100 | #29 | Exceptional 9.3% |
| Menominee | 99.8 /100 | #30 | Exceptional 9.4% |
| Finns | 99.8 /100 | #31 | Exceptional 9.4% |
| Northern Europeans | 99.8 /100 | #32 | Exceptional 9.4% |
| Native Hawaiians | 99.8 /100 | #33 | Exceptional 9.4% |
| British | 99.8 /100 | #34 | Exceptional 9.4% |
| Latvians | 99.8 /100 | #35 | Exceptional 9.5% |
| Czechoslovakians | 99.8 /100 | #36 | Exceptional 9.5% |