Liberian vs Bhutanese Cognitive Disability
COMPARE
Liberian
Bhutanese
Cognitive Disability
Cognitive Disability Comparison
Liberians
Bhutanese
18.6%
COGNITIVE DISABILITY
0.0/ 100
METRIC RATING
317th/ 347
METRIC RANK
16.6%
COGNITIVE DISABILITY
99.7/ 100
METRIC RATING
57th/ 347
METRIC RANK
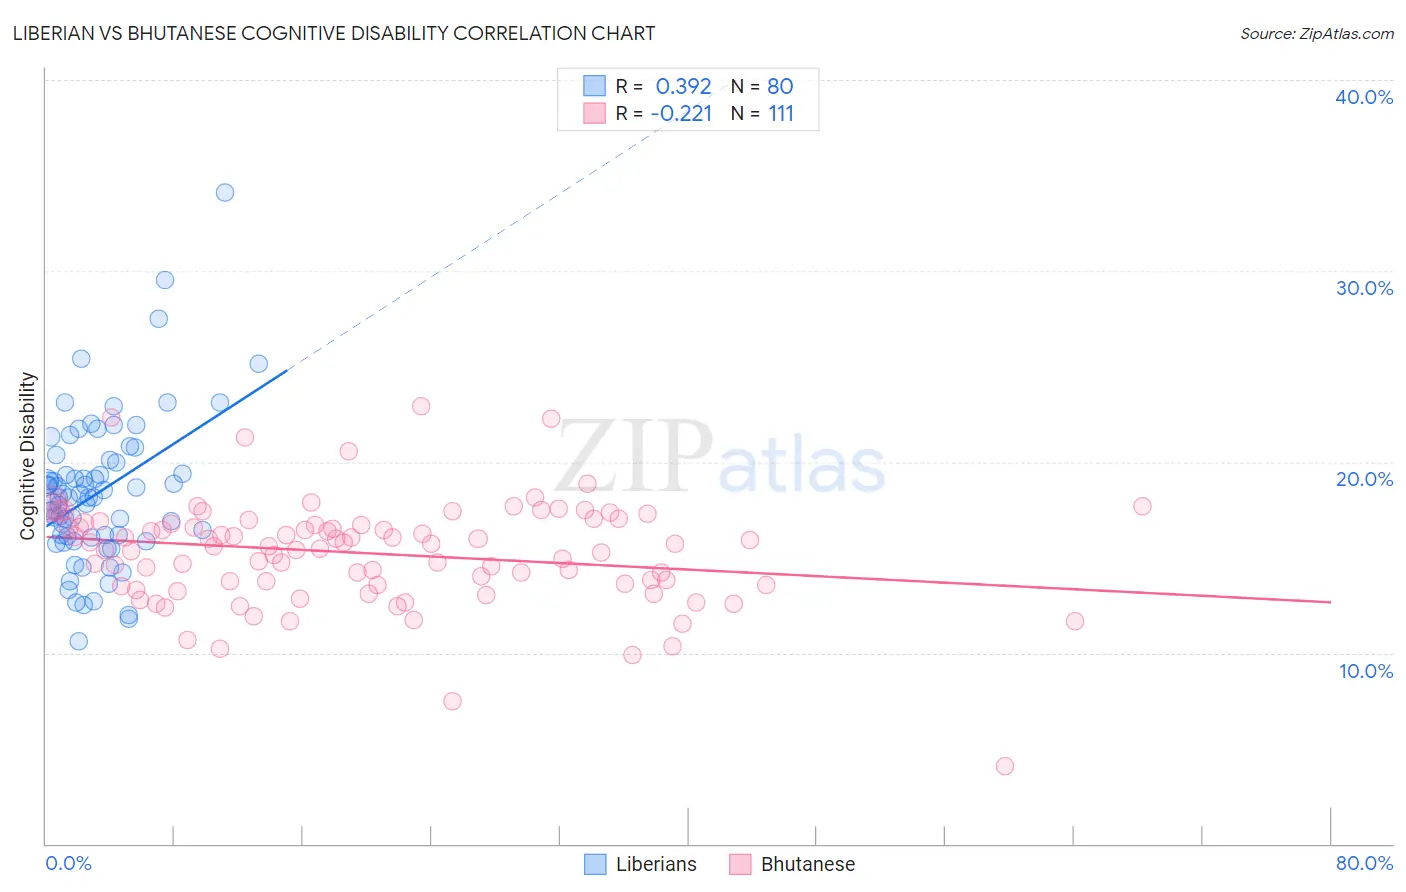
Liberian vs Bhutanese Cognitive Disability Correlation Chart
The statistical analysis conducted on geographies consisting of 118,084,793 people shows a mild positive correlation between the proportion of Liberians and percentage of population with cognitive disability in the United States with a correlation coefficient (R) of 0.392 and weighted average of 18.6%. Similarly, the statistical analysis conducted on geographies consisting of 455,511,378 people shows a weak negative correlation between the proportion of Bhutanese and percentage of population with cognitive disability in the United States with a correlation coefficient (R) of -0.221 and weighted average of 16.6%, a difference of 12.2%.
Cognitive Disability Correlation Summary
| Measurement | Liberian | Bhutanese |
| Minimum | 10.6% | 4.0% |
| Maximum | 34.1% | 22.9% |
| Range | 23.5% | 18.9% |
| Mean | 18.4% | 15.2% |
| Median | 18.1% | 15.6% |
| Interquartile 25% (IQ1) | 16.1% | 13.6% |
| Interquartile 75% (IQ3) | 20.1% | 16.8% |
| Interquartile Range (IQR) | 4.0% | 3.2% |
| Standard Deviation (Sample) | 3.9% | 2.8% |
| Standard Deviation (Population) | 3.9% | 2.7% |
Similar Demographics by Cognitive Disability
Demographics Similar to Liberians by Cognitive Disability
In terms of cognitive disability, the demographic groups most similar to Liberians are Immigrants from Middle Africa (18.6%, a difference of 0.080%), Bangladeshi (18.6%, a difference of 0.12%), Immigrants from Dominica (18.6%, a difference of 0.16%), Comanche (18.6%, a difference of 0.16%), and Apache (18.6%, a difference of 0.20%).
| Demographics | Rating | Rank | Cognitive Disability |
| Choctaw | 0.0 /100 | #310 | Tragic 18.4% |
| Hmong | 0.0 /100 | #311 | Tragic 18.4% |
| Chickasaw | 0.0 /100 | #312 | Tragic 18.5% |
| Yaqui | 0.0 /100 | #313 | Tragic 18.5% |
| Sub-Saharan Africans | 0.0 /100 | #314 | Tragic 18.5% |
| Immigrants | Dominica | 0.0 /100 | #315 | Tragic 18.6% |
| Immigrants | Middle Africa | 0.0 /100 | #316 | Tragic 18.6% |
| Liberians | 0.0 /100 | #317 | Tragic 18.6% |
| Bangladeshis | 0.0 /100 | #318 | Tragic 18.6% |
| Comanche | 0.0 /100 | #319 | Tragic 18.6% |
| Apache | 0.0 /100 | #320 | Tragic 18.6% |
| Africans | 0.0 /100 | #321 | Tragic 18.6% |
| Immigrants | Liberia | 0.0 /100 | #322 | Tragic 18.7% |
| Pueblo | 0.0 /100 | #323 | Tragic 18.7% |
| Dominicans | 0.0 /100 | #324 | Tragic 18.7% |
Demographics Similar to Bhutanese by Cognitive Disability
In terms of cognitive disability, the demographic groups most similar to Bhutanese are Austrian (16.6%, a difference of 0.010%), Pennsylvania German (16.6%, a difference of 0.080%), Immigrants from Peru (16.6%, a difference of 0.080%), Romanian (16.6%, a difference of 0.090%), and Immigrants from Venezuela (16.5%, a difference of 0.10%).
| Demographics | Rating | Rank | Cognitive Disability |
| Norwegians | 99.8 /100 | #50 | Exceptional 16.5% |
| Immigrants | Korea | 99.8 /100 | #51 | Exceptional 16.5% |
| Soviet Union | 99.8 /100 | #52 | Exceptional 16.5% |
| Swedes | 99.8 /100 | #53 | Exceptional 16.5% |
| Immigrants | Iran | 99.8 /100 | #54 | Exceptional 16.5% |
| Immigrants | Venezuela | 99.7 /100 | #55 | Exceptional 16.5% |
| Austrians | 99.7 /100 | #56 | Exceptional 16.6% |
| Bhutanese | 99.7 /100 | #57 | Exceptional 16.6% |
| Pennsylvania Germans | 99.7 /100 | #58 | Exceptional 16.6% |
| Immigrants | Peru | 99.7 /100 | #59 | Exceptional 16.6% |
| Romanians | 99.7 /100 | #60 | Exceptional 16.6% |
| Immigrants | England | 99.6 /100 | #61 | Exceptional 16.6% |
| Czechoslovakians | 99.6 /100 | #62 | Exceptional 16.6% |
| Argentineans | 99.6 /100 | #63 | Exceptional 16.6% |
| Venezuelans | 99.6 /100 | #64 | Exceptional 16.6% |