Liberian vs Mexican American Indian Disability Age 65 to 74
COMPARE
Liberian
Mexican American Indian
Disability Age 65 to 74
Disability Age 65 to 74 Comparison
Liberians
Mexican American Indians
25.6%
DISABILITY AGE 65 TO 74
0.1/ 100
METRIC RATING
268th/ 347
METRIC RANK
26.2%
DISABILITY AGE 65 TO 74
0.0/ 100
METRIC RATING
288th/ 347
METRIC RANK
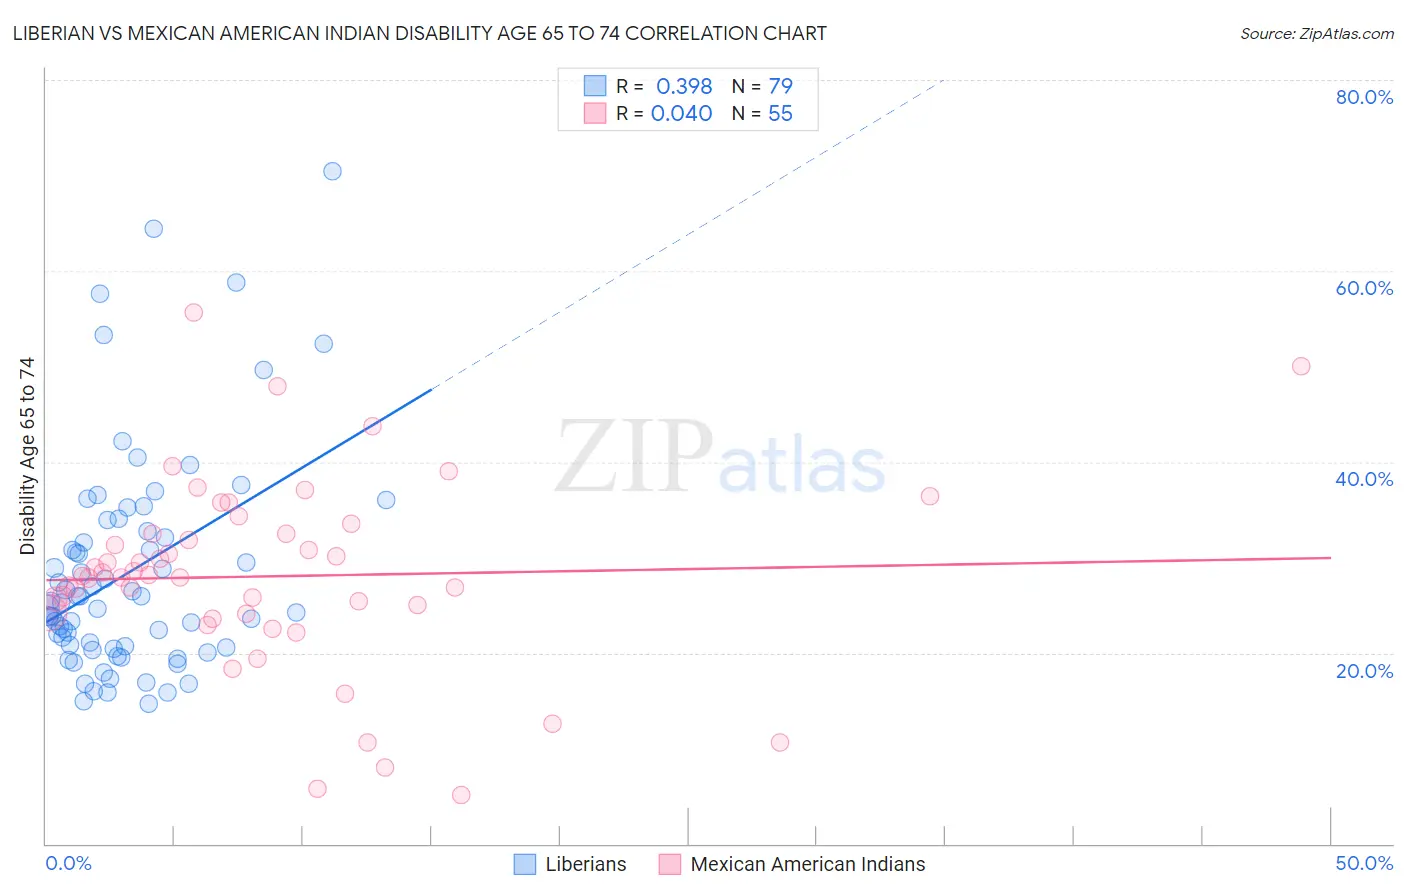
Liberian vs Mexican American Indian Disability Age 65 to 74 Correlation Chart
The statistical analysis conducted on geographies consisting of 117,958,133 people shows a mild positive correlation between the proportion of Liberians and percentage of population with a disability between the ages 65 and 75 in the United States with a correlation coefficient (R) of 0.398 and weighted average of 25.6%. Similarly, the statistical analysis conducted on geographies consisting of 317,155,514 people shows no correlation between the proportion of Mexican American Indians and percentage of population with a disability between the ages 65 and 75 in the United States with a correlation coefficient (R) of 0.040 and weighted average of 26.2%, a difference of 2.0%.
Disability Age 65 to 74 Correlation Summary
| Measurement | Liberian | Mexican American Indian |
| Minimum | 14.7% | 5.2% |
| Maximum | 70.5% | 55.7% |
| Range | 55.7% | 50.5% |
| Mean | 28.4% | 28.0% |
| Median | 25.2% | 28.1% |
| Interquartile 25% (IQ1) | 20.5% | 24.2% |
| Interquartile 75% (IQ3) | 32.7% | 32.5% |
| Interquartile Range (IQR) | 12.2% | 8.3% |
| Standard Deviation (Sample) | 11.5% | 10.0% |
| Standard Deviation (Population) | 11.5% | 9.9% |
Demographics Similar to Liberians and Mexican American Indians by Disability Age 65 to 74
In terms of disability age 65 to 74, the demographic groups most similar to Liberians are Hmong (25.7%, a difference of 0.12%), Immigrants from Guatemala (25.7%, a difference of 0.20%), Immigrants from Liberia (25.7%, a difference of 0.23%), Immigrants from Dominica (25.7%, a difference of 0.23%), and Japanese (25.7%, a difference of 0.36%). Similarly, the demographic groups most similar to Mexican American Indians are Immigrants from Laos (26.1%, a difference of 0.10%), Immigrants from Micronesia (26.1%, a difference of 0.16%), Immigrants from Congo (26.0%, a difference of 0.59%), Immigrants from the Azores (26.0%, a difference of 0.61%), and Spanish American (25.9%, a difference of 0.79%).
| Demographics | Rating | Rank | Disability Age 65 to 74 |
| Liberians | 0.1 /100 | #268 | Tragic 25.6% |
| Hmong | 0.1 /100 | #269 | Tragic 25.7% |
| Immigrants | Guatemala | 0.1 /100 | #270 | Tragic 25.7% |
| Immigrants | Liberia | 0.1 /100 | #271 | Tragic 25.7% |
| Immigrants | Dominica | 0.1 /100 | #272 | Tragic 25.7% |
| Japanese | 0.1 /100 | #273 | Tragic 25.7% |
| Americans | 0.1 /100 | #274 | Tragic 25.8% |
| Hondurans | 0.1 /100 | #275 | Tragic 25.8% |
| French American Indians | 0.1 /100 | #276 | Tragic 25.8% |
| Belizeans | 0.1 /100 | #277 | Tragic 25.8% |
| Immigrants | Belize | 0.1 /100 | #278 | Tragic 25.8% |
| U.S. Virgin Islanders | 0.1 /100 | #279 | Tragic 25.9% |
| Cree | 0.1 /100 | #280 | Tragic 25.9% |
| Immigrants | Honduras | 0.1 /100 | #281 | Tragic 25.9% |
| Delaware | 0.1 /100 | #282 | Tragic 25.9% |
| Spanish Americans | 0.0 /100 | #283 | Tragic 25.9% |
| Immigrants | Azores | 0.0 /100 | #284 | Tragic 26.0% |
| Immigrants | Congo | 0.0 /100 | #285 | Tragic 26.0% |
| Immigrants | Micronesia | 0.0 /100 | #286 | Tragic 26.1% |
| Immigrants | Laos | 0.0 /100 | #287 | Tragic 26.1% |
| Mexican American Indians | 0.0 /100 | #288 | Tragic 26.2% |