Liberian vs Immigrants from South Eastern Asia Cognitive Disability
COMPARE
Liberian
Immigrants from South Eastern Asia
Cognitive Disability
Cognitive Disability Comparison
Liberians
Immigrants from South Eastern Asia
18.6%
COGNITIVE DISABILITY
0.0/ 100
METRIC RATING
317th/ 347
METRIC RANK
17.0%
COGNITIVE DISABILITY
88.7/ 100
METRIC RATING
145th/ 347
METRIC RANK
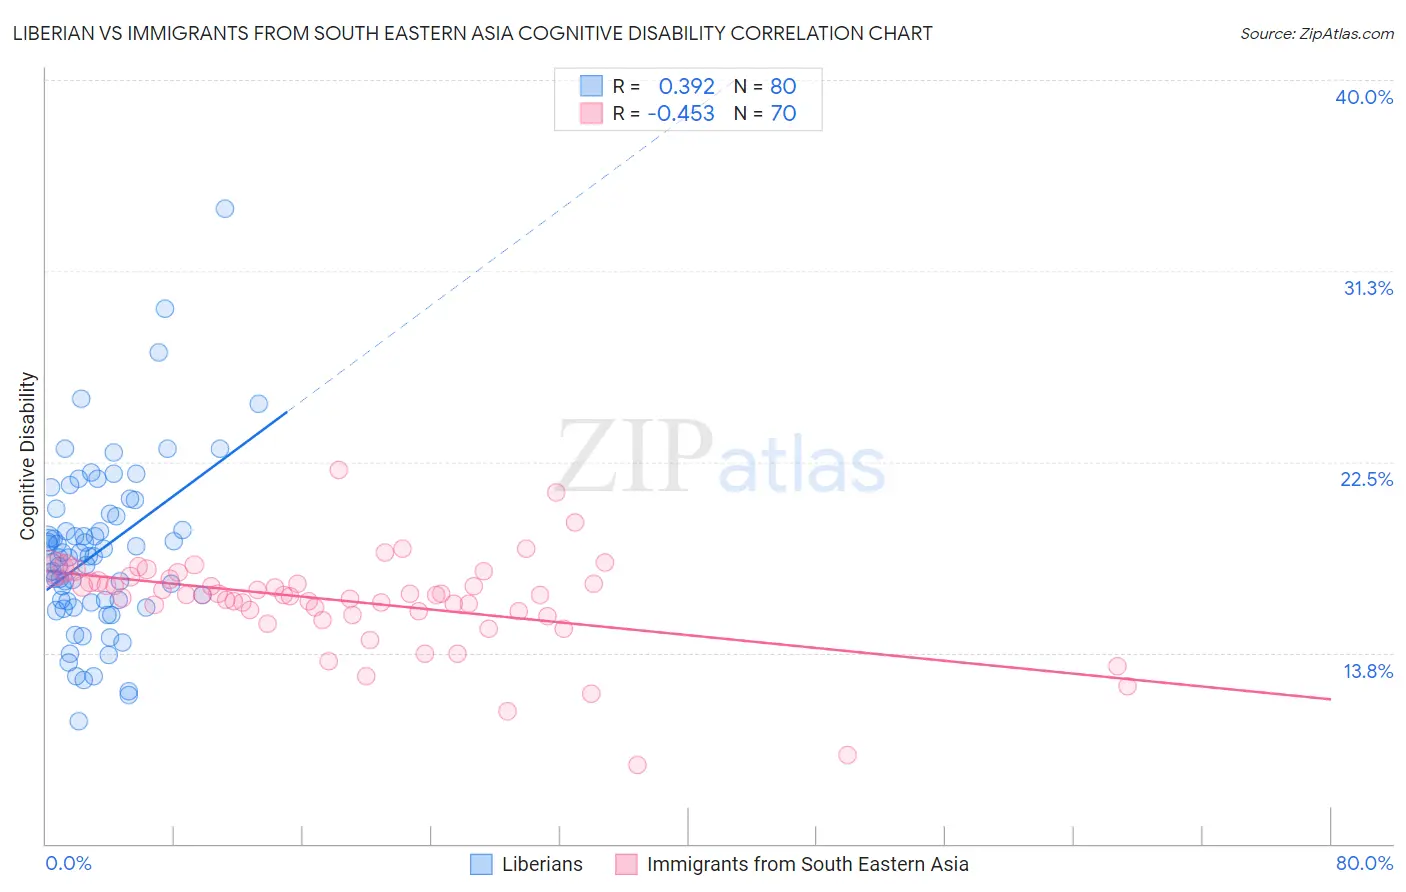
Liberian vs Immigrants from South Eastern Asia Cognitive Disability Correlation Chart
The statistical analysis conducted on geographies consisting of 118,084,793 people shows a mild positive correlation between the proportion of Liberians and percentage of population with cognitive disability in the United States with a correlation coefficient (R) of 0.392 and weighted average of 18.6%. Similarly, the statistical analysis conducted on geographies consisting of 512,576,863 people shows a moderate negative correlation between the proportion of Immigrants from South Eastern Asia and percentage of population with cognitive disability in the United States with a correlation coefficient (R) of -0.453 and weighted average of 17.0%, a difference of 9.2%.
Cognitive Disability Correlation Summary
| Measurement | Liberian | Immigrants from South Eastern Asia |
| Minimum | 10.6% | 8.6% |
| Maximum | 34.1% | 22.1% |
| Range | 23.5% | 13.5% |
| Mean | 18.4% | 16.1% |
| Median | 18.1% | 16.4% |
| Interquartile 25% (IQ1) | 16.1% | 15.6% |
| Interquartile 75% (IQ3) | 20.1% | 17.1% |
| Interquartile Range (IQR) | 4.0% | 1.5% |
| Standard Deviation (Sample) | 3.9% | 2.2% |
| Standard Deviation (Population) | 3.9% | 2.2% |
Similar Demographics by Cognitive Disability
Demographics Similar to Liberians by Cognitive Disability
In terms of cognitive disability, the demographic groups most similar to Liberians are Immigrants from Middle Africa (18.6%, a difference of 0.080%), Bangladeshi (18.6%, a difference of 0.12%), Immigrants from Dominica (18.6%, a difference of 0.16%), Comanche (18.6%, a difference of 0.16%), and Apache (18.6%, a difference of 0.20%).
| Demographics | Rating | Rank | Cognitive Disability |
| Choctaw | 0.0 /100 | #310 | Tragic 18.4% |
| Hmong | 0.0 /100 | #311 | Tragic 18.4% |
| Chickasaw | 0.0 /100 | #312 | Tragic 18.5% |
| Yaqui | 0.0 /100 | #313 | Tragic 18.5% |
| Sub-Saharan Africans | 0.0 /100 | #314 | Tragic 18.5% |
| Immigrants | Dominica | 0.0 /100 | #315 | Tragic 18.6% |
| Immigrants | Middle Africa | 0.0 /100 | #316 | Tragic 18.6% |
| Liberians | 0.0 /100 | #317 | Tragic 18.6% |
| Bangladeshis | 0.0 /100 | #318 | Tragic 18.6% |
| Comanche | 0.0 /100 | #319 | Tragic 18.6% |
| Apache | 0.0 /100 | #320 | Tragic 18.6% |
| Africans | 0.0 /100 | #321 | Tragic 18.6% |
| Immigrants | Liberia | 0.0 /100 | #322 | Tragic 18.7% |
| Pueblo | 0.0 /100 | #323 | Tragic 18.7% |
| Dominicans | 0.0 /100 | #324 | Tragic 18.7% |
Demographics Similar to Immigrants from South Eastern Asia by Cognitive Disability
In terms of cognitive disability, the demographic groups most similar to Immigrants from South Eastern Asia are British (17.0%, a difference of 0.050%), Immigrants from Brazil (17.0%, a difference of 0.050%), Costa Rican (17.0%, a difference of 0.050%), Carpatho Rusyn (17.0%, a difference of 0.070%), and Aleut (17.0%, a difference of 0.090%).
| Demographics | Rating | Rank | Cognitive Disability |
| Welsh | 90.8 /100 | #138 | Exceptional 17.0% |
| French | 90.0 /100 | #139 | Excellent 17.0% |
| Chileans | 89.9 /100 | #140 | Excellent 17.0% |
| Aleuts | 89.9 /100 | #141 | Excellent 17.0% |
| Carpatho Rusyns | 89.6 /100 | #142 | Excellent 17.0% |
| British | 89.3 /100 | #143 | Excellent 17.0% |
| Immigrants | Brazil | 89.3 /100 | #144 | Excellent 17.0% |
| Immigrants | South Eastern Asia | 88.7 /100 | #145 | Excellent 17.0% |
| Costa Ricans | 88.0 /100 | #146 | Excellent 17.0% |
| Scotch-Irish | 85.9 /100 | #147 | Excellent 17.1% |
| French Canadians | 85.7 /100 | #148 | Excellent 17.1% |
| Cypriots | 85.7 /100 | #149 | Excellent 17.1% |
| Basques | 85.5 /100 | #150 | Excellent 17.1% |
| Syrians | 83.0 /100 | #151 | Excellent 17.1% |
| Immigrants | Indonesia | 82.7 /100 | #152 | Excellent 17.1% |