Liberian vs Filipino Cognitive Disability
COMPARE
Liberian
Filipino
Cognitive Disability
Cognitive Disability Comparison
Liberians
Filipinos
18.6%
COGNITIVE DISABILITY
0.0/ 100
METRIC RATING
317th/ 347
METRIC RANK
16.4%
COGNITIVE DISABILITY
99.9/ 100
METRIC RATING
29th/ 347
METRIC RANK
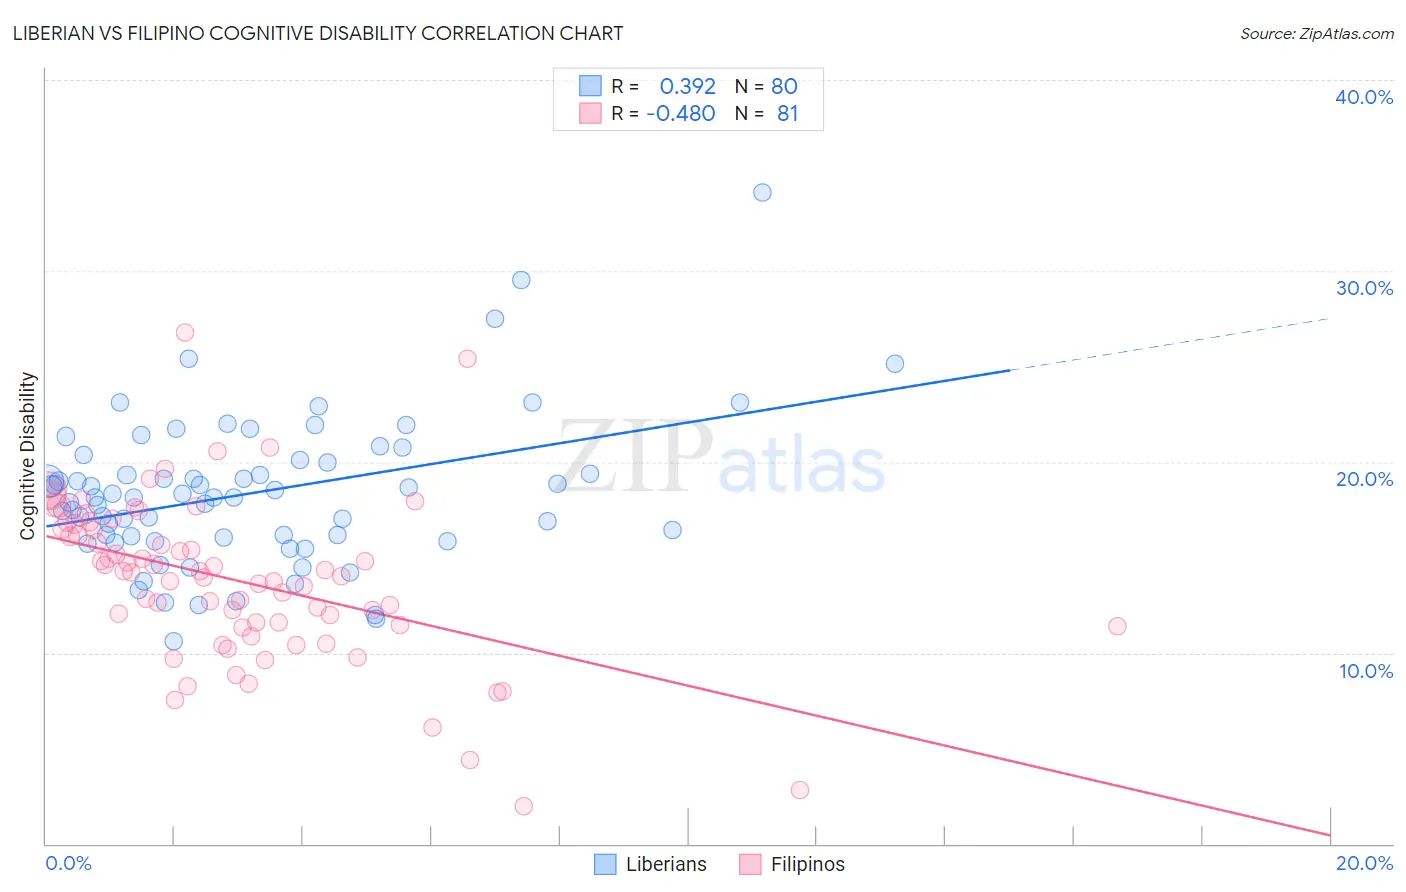
Liberian vs Filipino Cognitive Disability Correlation Chart
The statistical analysis conducted on geographies consisting of 118,084,793 people shows a mild positive correlation between the proportion of Liberians and percentage of population with cognitive disability in the United States with a correlation coefficient (R) of 0.392 and weighted average of 18.6%. Similarly, the statistical analysis conducted on geographies consisting of 254,348,780 people shows a moderate negative correlation between the proportion of Filipinos and percentage of population with cognitive disability in the United States with a correlation coefficient (R) of -0.480 and weighted average of 16.4%, a difference of 13.4%.
Cognitive Disability Correlation Summary
| Measurement | Liberian | Filipino |
| Minimum | 10.6% | 2.0% |
| Maximum | 34.1% | 26.8% |
| Range | 23.5% | 24.8% |
| Mean | 18.4% | 13.8% |
| Median | 18.1% | 14.2% |
| Interquartile 25% (IQ1) | 16.1% | 11.4% |
| Interquartile 75% (IQ3) | 20.1% | 16.6% |
| Interquartile Range (IQR) | 4.0% | 5.2% |
| Standard Deviation (Sample) | 3.9% | 4.3% |
| Standard Deviation (Population) | 3.9% | 4.2% |
Similar Demographics by Cognitive Disability
Demographics Similar to Liberians by Cognitive Disability
In terms of cognitive disability, the demographic groups most similar to Liberians are Immigrants from Middle Africa (18.6%, a difference of 0.080%), Bangladeshi (18.6%, a difference of 0.12%), Immigrants from Dominica (18.6%, a difference of 0.16%), Comanche (18.6%, a difference of 0.16%), and Apache (18.6%, a difference of 0.20%).
| Demographics | Rating | Rank | Cognitive Disability |
| Choctaw | 0.0 /100 | #310 | Tragic 18.4% |
| Hmong | 0.0 /100 | #311 | Tragic 18.4% |
| Chickasaw | 0.0 /100 | #312 | Tragic 18.5% |
| Yaqui | 0.0 /100 | #313 | Tragic 18.5% |
| Sub-Saharan Africans | 0.0 /100 | #314 | Tragic 18.5% |
| Immigrants | Dominica | 0.0 /100 | #315 | Tragic 18.6% |
| Immigrants | Middle Africa | 0.0 /100 | #316 | Tragic 18.6% |
| Liberians | 0.0 /100 | #317 | Tragic 18.6% |
| Bangladeshis | 0.0 /100 | #318 | Tragic 18.6% |
| Comanche | 0.0 /100 | #319 | Tragic 18.6% |
| Apache | 0.0 /100 | #320 | Tragic 18.6% |
| Africans | 0.0 /100 | #321 | Tragic 18.6% |
| Immigrants | Liberia | 0.0 /100 | #322 | Tragic 18.7% |
| Pueblo | 0.0 /100 | #323 | Tragic 18.7% |
| Dominicans | 0.0 /100 | #324 | Tragic 18.7% |
Demographics Similar to Filipinos by Cognitive Disability
In terms of cognitive disability, the demographic groups most similar to Filipinos are Czech (16.4%, a difference of 0.0%), Immigrants from Romania (16.4%, a difference of 0.020%), Immigrants from Pakistan (16.4%, a difference of 0.030%), Polish (16.4%, a difference of 0.030%), and Immigrants from Croatia (16.4%, a difference of 0.050%).
| Demographics | Rating | Rank | Cognitive Disability |
| Immigrants | South Central Asia | 99.9 /100 | #22 | Exceptional 16.4% |
| Croatians | 99.9 /100 | #23 | Exceptional 16.4% |
| Immigrants | Argentina | 99.9 /100 | #24 | Exceptional 16.4% |
| Luxembourgers | 99.9 /100 | #25 | Exceptional 16.4% |
| Immigrants | Croatia | 99.9 /100 | #26 | Exceptional 16.4% |
| Immigrants | Pakistan | 99.9 /100 | #27 | Exceptional 16.4% |
| Poles | 99.9 /100 | #28 | Exceptional 16.4% |
| Filipinos | 99.9 /100 | #29 | Exceptional 16.4% |
| Czechs | 99.9 /100 | #30 | Exceptional 16.4% |
| Immigrants | Romania | 99.9 /100 | #31 | Exceptional 16.4% |
| Immigrants | Israel | 99.9 /100 | #32 | Exceptional 16.4% |
| Italians | 99.9 /100 | #33 | Exceptional 16.4% |
| Russians | 99.9 /100 | #34 | Exceptional 16.4% |
| Slovaks | 99.9 /100 | #35 | Exceptional 16.4% |
| Greeks | 99.9 /100 | #36 | Exceptional 16.4% |