Immigrants from Panama vs Asian Disability
COMPARE
Immigrants from Panama
Asian
Disability
Disability Comparison
Immigrants from Panama
Asians
11.9%
DISABILITY
14.6/ 100
METRIC RATING
199th/ 347
METRIC RANK
10.4%
DISABILITY
100.0/ 100
METRIC RATING
21st/ 347
METRIC RANK
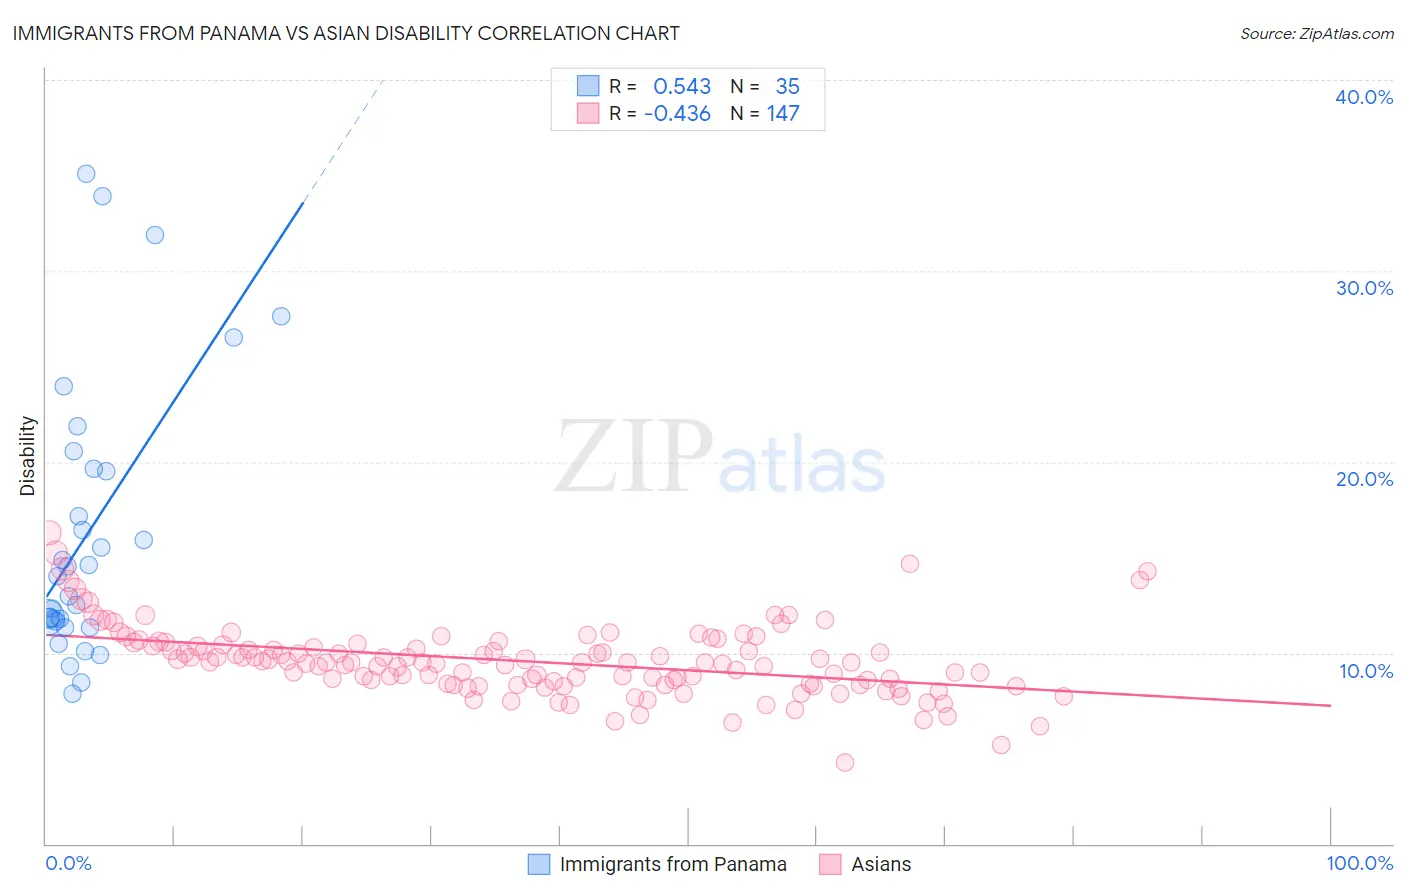
Immigrants from Panama vs Asian Disability Correlation Chart
The statistical analysis conducted on geographies consisting of 221,178,706 people shows a substantial positive correlation between the proportion of Immigrants from Panama and percentage of population with a disability in the United States with a correlation coefficient (R) of 0.543 and weighted average of 11.9%. Similarly, the statistical analysis conducted on geographies consisting of 550,807,105 people shows a moderate negative correlation between the proportion of Asians and percentage of population with a disability in the United States with a correlation coefficient (R) of -0.436 and weighted average of 10.4%, a difference of 14.2%.
Disability Correlation Summary
| Measurement | Immigrants from Panama | Asian |
| Minimum | 7.9% | 4.2% |
| Maximum | 35.1% | 16.3% |
| Range | 27.2% | 12.0% |
| Mean | 16.3% | 9.6% |
| Median | 14.0% | 9.5% |
| Interquartile 25% (IQ1) | 11.7% | 8.4% |
| Interquartile 75% (IQ3) | 19.7% | 10.4% |
| Interquartile Range (IQR) | 8.0% | 2.1% |
| Standard Deviation (Sample) | 7.3% | 1.9% |
| Standard Deviation (Population) | 7.2% | 1.9% |
Similar Demographics by Disability
Demographics Similar to Immigrants from Panama by Disability
In terms of disability, the demographic groups most similar to Immigrants from Panama are Ukrainian (11.9%, a difference of 0.010%), Immigrants from Belize (11.9%, a difference of 0.050%), Serbian (11.9%, a difference of 0.070%), Barbadian (11.9%, a difference of 0.10%), and Belizean (11.9%, a difference of 0.16%).
| Demographics | Rating | Rank | Disability |
| Lithuanians | 18.8 /100 | #192 | Poor 11.9% |
| Immigrants | Bosnia and Herzegovina | 18.0 /100 | #193 | Poor 11.9% |
| Somalis | 17.3 /100 | #194 | Poor 11.9% |
| Barbadians | 15.8 /100 | #195 | Poor 11.9% |
| Serbians | 15.4 /100 | #196 | Poor 11.9% |
| Immigrants | Belize | 15.2 /100 | #197 | Poor 11.9% |
| Ukrainians | 14.7 /100 | #198 | Poor 11.9% |
| Immigrants | Panama | 14.6 /100 | #199 | Poor 11.9% |
| Belizeans | 12.8 /100 | #200 | Poor 11.9% |
| Assyrians/Chaldeans/Syriacs | 12.6 /100 | #201 | Poor 11.9% |
| Immigrants | England | 12.0 /100 | #202 | Poor 12.0% |
| British West Indians | 11.5 /100 | #203 | Poor 12.0% |
| Mexican American Indians | 11.4 /100 | #204 | Poor 12.0% |
| Immigrants | Western Europe | 10.1 /100 | #205 | Poor 12.0% |
| Immigrants | Senegal | 9.4 /100 | #206 | Tragic 12.0% |
Demographics Similar to Asians by Disability
In terms of disability, the demographic groups most similar to Asians are Immigrants from Venezuela (10.4%, a difference of 0.030%), Immigrants from Sri Lanka (10.5%, a difference of 0.10%), Burmese (10.4%, a difference of 0.72%), Immigrants from Pakistan (10.4%, a difference of 0.72%), and Immigrants from Asia (10.5%, a difference of 0.80%).
| Demographics | Rating | Rank | Disability |
| Immigrants | Korea | 100.0 /100 | #14 | Exceptional 10.2% |
| Okinawans | 100.0 /100 | #15 | Exceptional 10.3% |
| Indians (Asian) | 100.0 /100 | #16 | Exceptional 10.3% |
| Immigrants | Iran | 100.0 /100 | #17 | Exceptional 10.3% |
| Burmese | 100.0 /100 | #18 | Exceptional 10.4% |
| Immigrants | Pakistan | 100.0 /100 | #19 | Exceptional 10.4% |
| Immigrants | Venezuela | 100.0 /100 | #20 | Exceptional 10.4% |
| Asians | 100.0 /100 | #21 | Exceptional 10.4% |
| Immigrants | Sri Lanka | 100.0 /100 | #22 | Exceptional 10.5% |
| Immigrants | Asia | 100.0 /100 | #23 | Exceptional 10.5% |
| Venezuelans | 100.0 /100 | #24 | Exceptional 10.5% |
| Immigrants | Malaysia | 100.0 /100 | #25 | Exceptional 10.6% |
| Argentineans | 100.0 /100 | #26 | Exceptional 10.6% |
| Cypriots | 100.0 /100 | #27 | Exceptional 10.6% |
| Egyptians | 100.0 /100 | #28 | Exceptional 10.6% |