Pueblo vs Asian Disability
COMPARE
Pueblo
Asian
Disability
Disability Comparison
Pueblo
Asians
14.4%
DISABILITY
0.0/ 100
METRIC RATING
332nd/ 347
METRIC RANK
10.4%
DISABILITY
100.0/ 100
METRIC RATING
21st/ 347
METRIC RANK
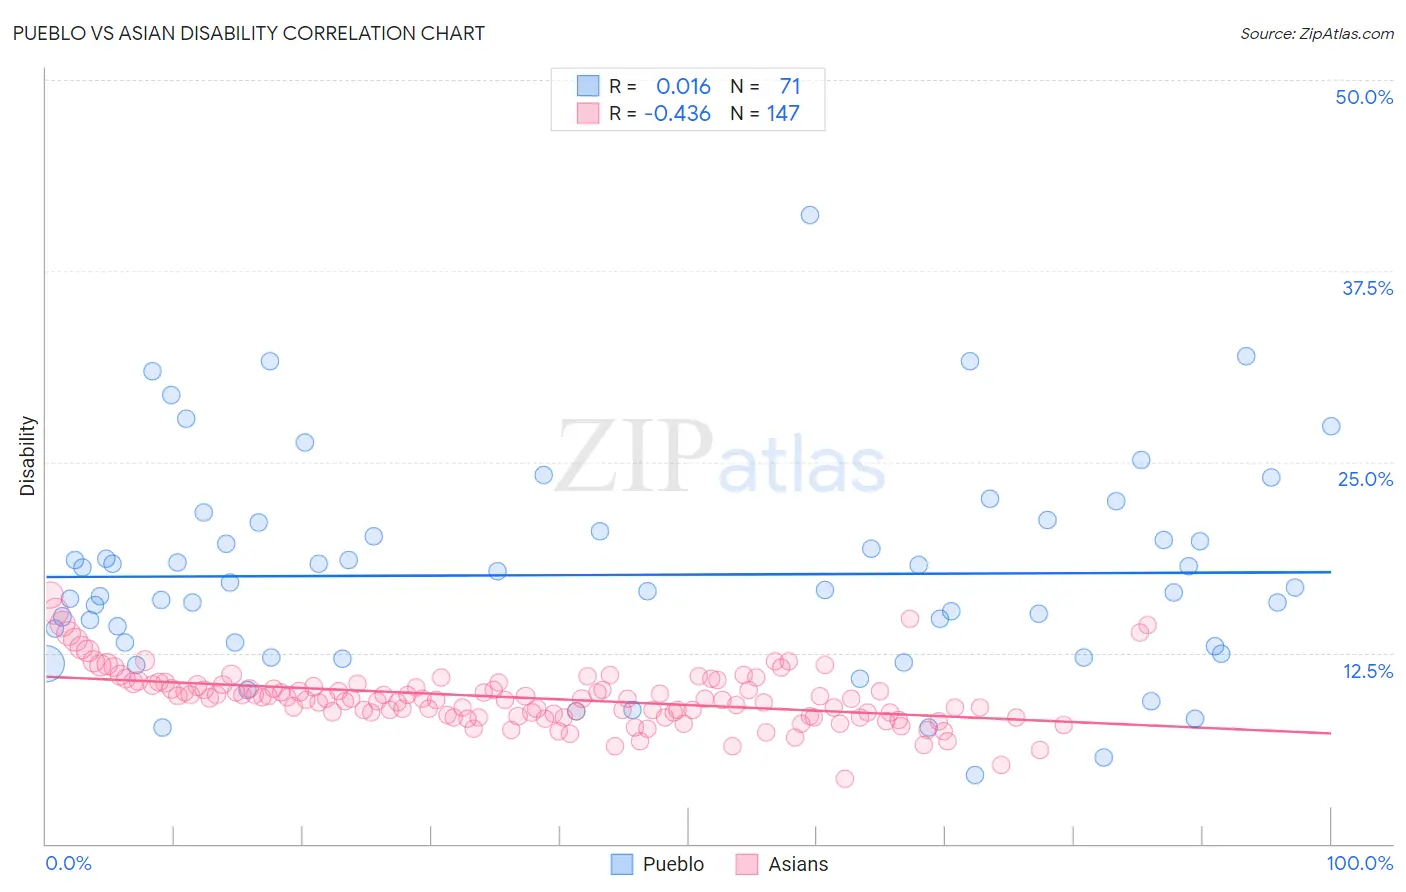
Pueblo vs Asian Disability Correlation Chart
The statistical analysis conducted on geographies consisting of 120,077,777 people shows no correlation between the proportion of Pueblo and percentage of population with a disability in the United States with a correlation coefficient (R) of 0.016 and weighted average of 14.4%. Similarly, the statistical analysis conducted on geographies consisting of 550,807,105 people shows a moderate negative correlation between the proportion of Asians and percentage of population with a disability in the United States with a correlation coefficient (R) of -0.436 and weighted average of 10.4%, a difference of 38.3%.
Disability Correlation Summary
| Measurement | Pueblo | Asian |
| Minimum | 4.5% | 4.2% |
| Maximum | 41.2% | 16.3% |
| Range | 36.7% | 12.0% |
| Mean | 17.6% | 9.6% |
| Median | 16.6% | 9.5% |
| Interquartile 25% (IQ1) | 13.0% | 8.4% |
| Interquartile 75% (IQ3) | 20.5% | 10.4% |
| Interquartile Range (IQR) | 7.5% | 2.1% |
| Standard Deviation (Sample) | 6.9% | 1.9% |
| Standard Deviation (Population) | 6.8% | 1.9% |
Similar Demographics by Disability
Demographics Similar to Pueblo by Disability
In terms of disability, the demographic groups most similar to Pueblo are Alaskan Athabascan (14.4%, a difference of 0.020%), Cajun (14.6%, a difference of 1.1%), Yuman (14.6%, a difference of 1.2%), Navajo (14.3%, a difference of 1.3%), and Potawatomi (14.2%, a difference of 1.9%).
| Demographics | Rating | Rank | Disability |
| Natives/Alaskans | 0.0 /100 | #325 | Tragic 14.2% |
| Osage | 0.0 /100 | #326 | Tragic 14.2% |
| Ottawa | 0.0 /100 | #327 | Tragic 14.2% |
| Immigrants | Azores | 0.0 /100 | #328 | Tragic 14.2% |
| Potawatomi | 0.0 /100 | #329 | Tragic 14.2% |
| Navajo | 0.0 /100 | #330 | Tragic 14.3% |
| Alaskan Athabascans | 0.0 /100 | #331 | Tragic 14.4% |
| Pueblo | 0.0 /100 | #332 | Tragic 14.4% |
| Cajuns | 0.0 /100 | #333 | Tragic 14.6% |
| Yuman | 0.0 /100 | #334 | Tragic 14.6% |
| Tohono O'odham | 0.0 /100 | #335 | Tragic 14.8% |
| Cherokee | 0.0 /100 | #336 | Tragic 14.8% |
| Seminole | 0.0 /100 | #337 | Tragic 14.9% |
| Dutch West Indians | 0.0 /100 | #338 | Tragic 14.9% |
| Chickasaw | 0.0 /100 | #339 | Tragic 15.2% |
Demographics Similar to Asians by Disability
In terms of disability, the demographic groups most similar to Asians are Immigrants from Venezuela (10.4%, a difference of 0.030%), Immigrants from Sri Lanka (10.5%, a difference of 0.10%), Burmese (10.4%, a difference of 0.72%), Immigrants from Pakistan (10.4%, a difference of 0.72%), and Immigrants from Asia (10.5%, a difference of 0.80%).
| Demographics | Rating | Rank | Disability |
| Immigrants | Korea | 100.0 /100 | #14 | Exceptional 10.2% |
| Okinawans | 100.0 /100 | #15 | Exceptional 10.3% |
| Indians (Asian) | 100.0 /100 | #16 | Exceptional 10.3% |
| Immigrants | Iran | 100.0 /100 | #17 | Exceptional 10.3% |
| Burmese | 100.0 /100 | #18 | Exceptional 10.4% |
| Immigrants | Pakistan | 100.0 /100 | #19 | Exceptional 10.4% |
| Immigrants | Venezuela | 100.0 /100 | #20 | Exceptional 10.4% |
| Asians | 100.0 /100 | #21 | Exceptional 10.4% |
| Immigrants | Sri Lanka | 100.0 /100 | #22 | Exceptional 10.5% |
| Immigrants | Asia | 100.0 /100 | #23 | Exceptional 10.5% |
| Venezuelans | 100.0 /100 | #24 | Exceptional 10.5% |
| Immigrants | Malaysia | 100.0 /100 | #25 | Exceptional 10.6% |
| Argentineans | 100.0 /100 | #26 | Exceptional 10.6% |
| Cypriots | 100.0 /100 | #27 | Exceptional 10.6% |
| Egyptians | 100.0 /100 | #28 | Exceptional 10.6% |