Laotian vs Soviet Union 7th Grade
COMPARE
Laotian
Soviet Union
7th Grade
7th Grade Comparison
Laotians
Soviet Union
95.7%
7TH GRADE
6.8/ 100
METRIC RATING
222nd/ 347
METRIC RANK
96.4%
7TH GRADE
91.2/ 100
METRIC RATING
134th/ 347
METRIC RANK
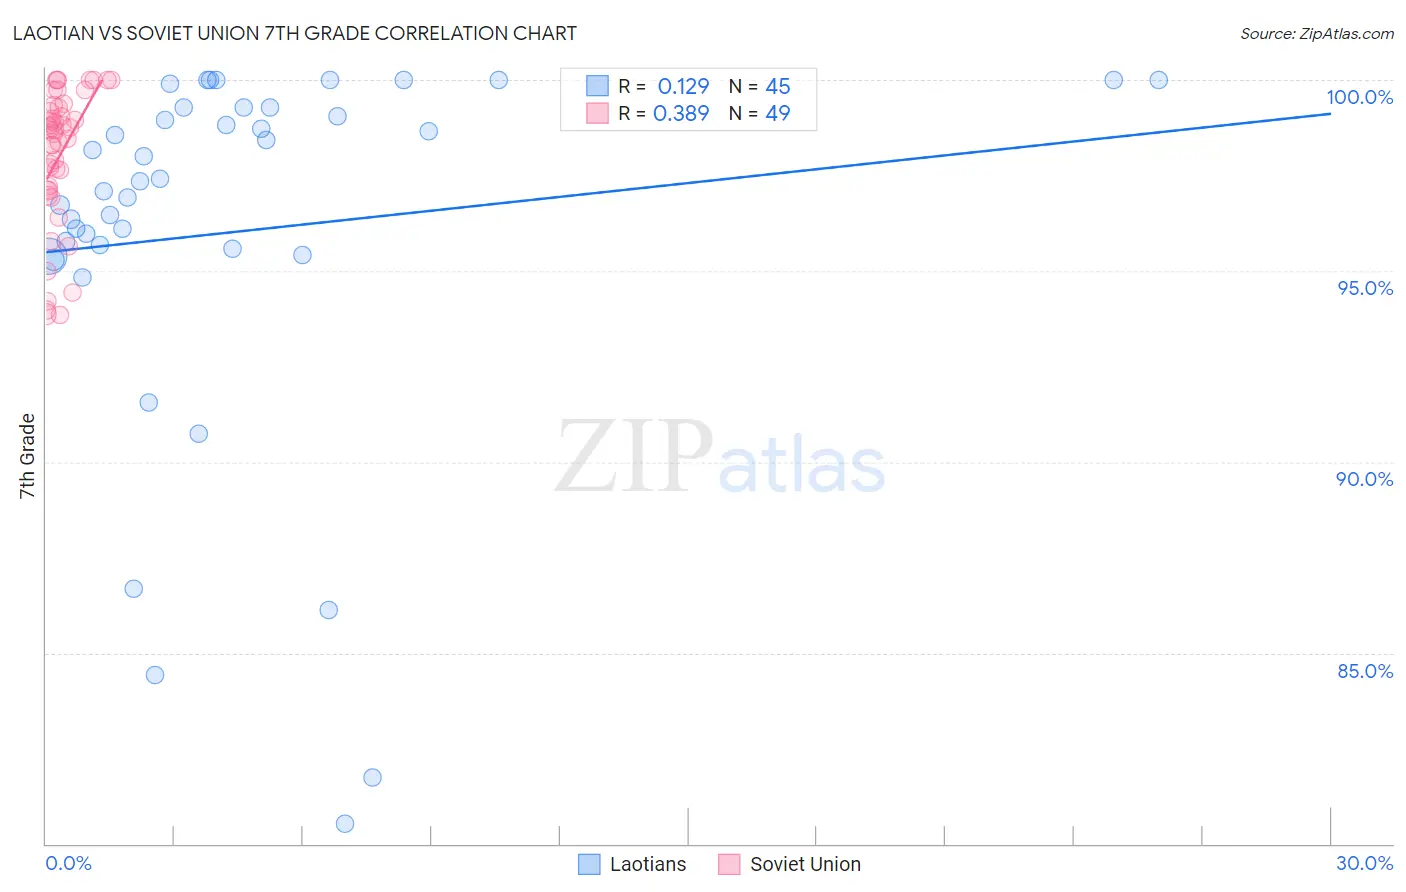
Laotian vs Soviet Union 7th Grade Correlation Chart
The statistical analysis conducted on geographies consisting of 224,856,886 people shows a poor positive correlation between the proportion of Laotians and percentage of population with at least 7th grade education in the United States with a correlation coefficient (R) of 0.129 and weighted average of 95.7%. Similarly, the statistical analysis conducted on geographies consisting of 43,454,395 people shows a mild positive correlation between the proportion of Soviet Union and percentage of population with at least 7th grade education in the United States with a correlation coefficient (R) of 0.389 and weighted average of 96.4%, a difference of 0.76%.
7th Grade Correlation Summary
| Measurement | Laotian | Soviet Union |
| Minimum | 80.5% | 93.9% |
| Maximum | 100.0% | 100.0% |
| Range | 19.5% | 6.1% |
| Mean | 96.0% | 98.0% |
| Median | 97.4% | 98.7% |
| Interquartile 25% (IQ1) | 95.5% | 97.1% |
| Interquartile 75% (IQ3) | 99.3% | 99.3% |
| Interquartile Range (IQR) | 3.8% | 2.2% |
| Standard Deviation (Sample) | 4.9% | 1.8% |
| Standard Deviation (Population) | 4.8% | 1.8% |
Similar Demographics by 7th Grade
Demographics Similar to Laotians by 7th Grade
In terms of 7th grade, the demographic groups most similar to Laotians are Samoan (95.7%, a difference of 0.0%), Immigrants from Syria (95.7%, a difference of 0.0%), Immigrants from Oceania (95.7%, a difference of 0.0%), Subsaharan African (95.7%, a difference of 0.010%), and Immigrants from Southern Europe (95.7%, a difference of 0.020%).
| Demographics | Rating | Rank | 7th Grade |
| Spanish Americans | 9.3 /100 | #215 | Tragic 95.7% |
| Immigrants | Chile | 9.1 /100 | #216 | Tragic 95.7% |
| Immigrants | Pakistan | 9.0 /100 | #217 | Tragic 95.7% |
| Immigrants | Liberia | 8.1 /100 | #218 | Tragic 95.7% |
| Immigrants | Southern Europe | 7.9 /100 | #219 | Tragic 95.7% |
| Sub-Saharan Africans | 7.2 /100 | #220 | Tragic 95.7% |
| Samoans | 7.0 /100 | #221 | Tragic 95.7% |
| Laotians | 6.8 /100 | #222 | Tragic 95.7% |
| Immigrants | Syria | 6.7 /100 | #223 | Tragic 95.7% |
| Immigrants | Oceania | 6.7 /100 | #224 | Tragic 95.7% |
| Immigrants | Malaysia | 6.2 /100 | #225 | Tragic 95.6% |
| Immigrants | Eastern Asia | 5.8 /100 | #226 | Tragic 95.6% |
| Immigrants | Western Asia | 5.4 /100 | #227 | Tragic 95.6% |
| Immigrants | Eastern Africa | 5.1 /100 | #228 | Tragic 95.6% |
| Immigrants | Panama | 4.9 /100 | #229 | Tragic 95.6% |
Demographics Similar to Soviet Union by 7th Grade
In terms of 7th grade, the demographic groups most similar to Soviet Union are Immigrants from Kuwait (96.4%, a difference of 0.0%), Colville (96.4%, a difference of 0.010%), Hmong (96.4%, a difference of 0.010%), Immigrants from Hungary (96.4%, a difference of 0.010%), and Filipino (96.4%, a difference of 0.020%).
| Demographics | Rating | Rank | 7th Grade |
| Immigrants | Bosnia and Herzegovina | 93.3 /100 | #127 | Exceptional 96.4% |
| Immigrants | Romania | 93.2 /100 | #128 | Exceptional 96.4% |
| Immigrants | North Macedonia | 93.1 /100 | #129 | Exceptional 96.4% |
| Immigrants | Serbia | 92.8 /100 | #130 | Exceptional 96.4% |
| Filipinos | 92.1 /100 | #131 | Exceptional 96.4% |
| Colville | 91.7 /100 | #132 | Exceptional 96.4% |
| Hmong | 91.5 /100 | #133 | Exceptional 96.4% |
| Soviet Union | 91.2 /100 | #134 | Exceptional 96.4% |
| Immigrants | Kuwait | 91.1 /100 | #135 | Exceptional 96.4% |
| Immigrants | Hungary | 90.6 /100 | #136 | Exceptional 96.4% |
| Immigrants | Turkey | 90.2 /100 | #137 | Exceptional 96.4% |
| Jordanians | 90.0 /100 | #138 | Excellent 96.4% |
| Basques | 89.3 /100 | #139 | Excellent 96.4% |
| Cambodians | 88.3 /100 | #140 | Excellent 96.3% |
| Immigrants | South Central Asia | 87.1 /100 | #141 | Excellent 96.3% |