Laotian vs Immigrants from Portugal Male Disability
COMPARE
Laotian
Immigrants from Portugal
Male Disability
Male Disability Comparison
Laotians
Immigrants from Portugal
10.6%
MALE DISABILITY
98.6/ 100
METRIC RATING
77th/ 347
METRIC RANK
12.3%
MALE DISABILITY
0.1/ 100
METRIC RATING
265th/ 347
METRIC RANK
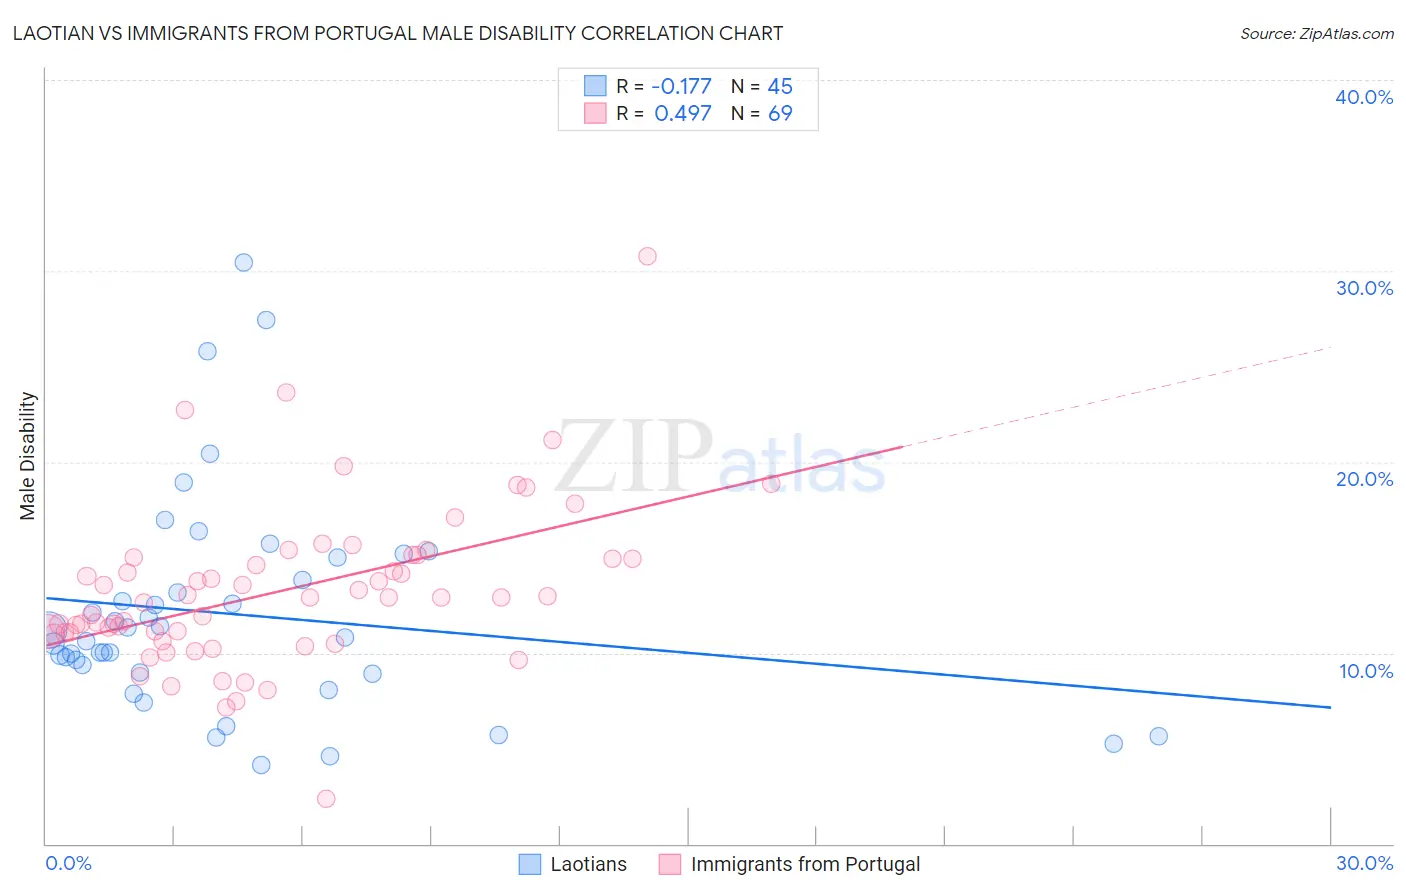
Laotian vs Immigrants from Portugal Male Disability Correlation Chart
The statistical analysis conducted on geographies consisting of 224,854,560 people shows a poor negative correlation between the proportion of Laotians and percentage of males with a disability in the United States with a correlation coefficient (R) of -0.177 and weighted average of 10.6%. Similarly, the statistical analysis conducted on geographies consisting of 174,781,482 people shows a moderate positive correlation between the proportion of Immigrants from Portugal and percentage of males with a disability in the United States with a correlation coefficient (R) of 0.497 and weighted average of 12.3%, a difference of 16.2%.
Male Disability Correlation Summary
| Measurement | Laotian | Immigrants from Portugal |
| Minimum | 4.1% | 2.4% |
| Maximum | 30.4% | 30.8% |
| Range | 26.3% | 28.4% |
| Mean | 12.0% | 13.2% |
| Median | 10.8% | 12.9% |
| Interquartile 25% (IQ1) | 9.0% | 11.0% |
| Interquartile 75% (IQ3) | 14.4% | 15.0% |
| Interquartile Range (IQR) | 5.4% | 3.9% |
| Standard Deviation (Sample) | 5.7% | 4.2% |
| Standard Deviation (Population) | 5.6% | 4.2% |
Similar Demographics by Male Disability
Demographics Similar to Laotians by Male Disability
In terms of male disability, the demographic groups most similar to Laotians are Immigrants from Russia (10.6%, a difference of 0.020%), Immigrants from Sierra Leone (10.5%, a difference of 0.060%), Sierra Leonean (10.5%, a difference of 0.10%), Immigrants from Lebanon (10.5%, a difference of 0.21%), and Zimbabwean (10.6%, a difference of 0.25%).
| Demographics | Rating | Rank | Male Disability |
| Immigrants | Bulgaria | 99.1 /100 | #70 | Exceptional 10.5% |
| Immigrants | Cameroon | 99.0 /100 | #71 | Exceptional 10.5% |
| Immigrants | Serbia | 99.0 /100 | #72 | Exceptional 10.5% |
| Immigrants | Lithuania | 98.9 /100 | #73 | Exceptional 10.5% |
| Immigrants | Lebanon | 98.8 /100 | #74 | Exceptional 10.5% |
| Sierra Leoneans | 98.7 /100 | #75 | Exceptional 10.5% |
| Immigrants | Sierra Leone | 98.7 /100 | #76 | Exceptional 10.5% |
| Laotians | 98.6 /100 | #77 | Exceptional 10.6% |
| Immigrants | Russia | 98.6 /100 | #78 | Exceptional 10.6% |
| Zimbabweans | 98.4 /100 | #79 | Exceptional 10.6% |
| Immigrants | Jordan | 98.4 /100 | #80 | Exceptional 10.6% |
| Immigrants | Chile | 98.3 /100 | #81 | Exceptional 10.6% |
| Immigrants | Guyana | 98.2 /100 | #82 | Exceptional 10.6% |
| Immigrants | Poland | 98.1 /100 | #83 | Exceptional 10.6% |
| Bulgarians | 98.1 /100 | #84 | Exceptional 10.6% |
Demographics Similar to Immigrants from Portugal by Male Disability
In terms of male disability, the demographic groups most similar to Immigrants from Portugal are Hawaiian (12.3%, a difference of 0.020%), Immigrants from Germany (12.3%, a difference of 0.070%), Portuguese (12.3%, a difference of 0.19%), Czechoslovakian (12.3%, a difference of 0.19%), and Spaniard (12.3%, a difference of 0.28%).
| Demographics | Rating | Rank | Male Disability |
| Basques | 0.3 /100 | #258 | Tragic 12.1% |
| Belgians | 0.3 /100 | #259 | Tragic 12.1% |
| Swedes | 0.3 /100 | #260 | Tragic 12.1% |
| Slavs | 0.2 /100 | #261 | Tragic 12.2% |
| Norwegians | 0.2 /100 | #262 | Tragic 12.2% |
| Canadians | 0.2 /100 | #263 | Tragic 12.2% |
| Nepalese | 0.2 /100 | #264 | Tragic 12.2% |
| Immigrants | Portugal | 0.1 /100 | #265 | Tragic 12.3% |
| Hawaiians | 0.1 /100 | #266 | Tragic 12.3% |
| Immigrants | Germany | 0.1 /100 | #267 | Tragic 12.3% |
| Portuguese | 0.1 /100 | #268 | Tragic 12.3% |
| Czechoslovakians | 0.1 /100 | #269 | Tragic 12.3% |
| Spaniards | 0.1 /100 | #270 | Tragic 12.3% |
| Scandinavians | 0.1 /100 | #271 | Tragic 12.3% |
| Hmong | 0.0 /100 | #272 | Tragic 12.5% |