Kenyan vs Immigrants from South Africa Hearing Disability
COMPARE
Kenyan
Immigrants from South Africa
Hearing Disability
Hearing Disability Comparison
Kenyans
Immigrants from South Africa
2.8%
HEARING DISABILITY
89.8/ 100
METRIC RATING
119th/ 347
METRIC RANK
3.1%
HEARING DISABILITY
31.1/ 100
METRIC RATING
190th/ 347
METRIC RANK
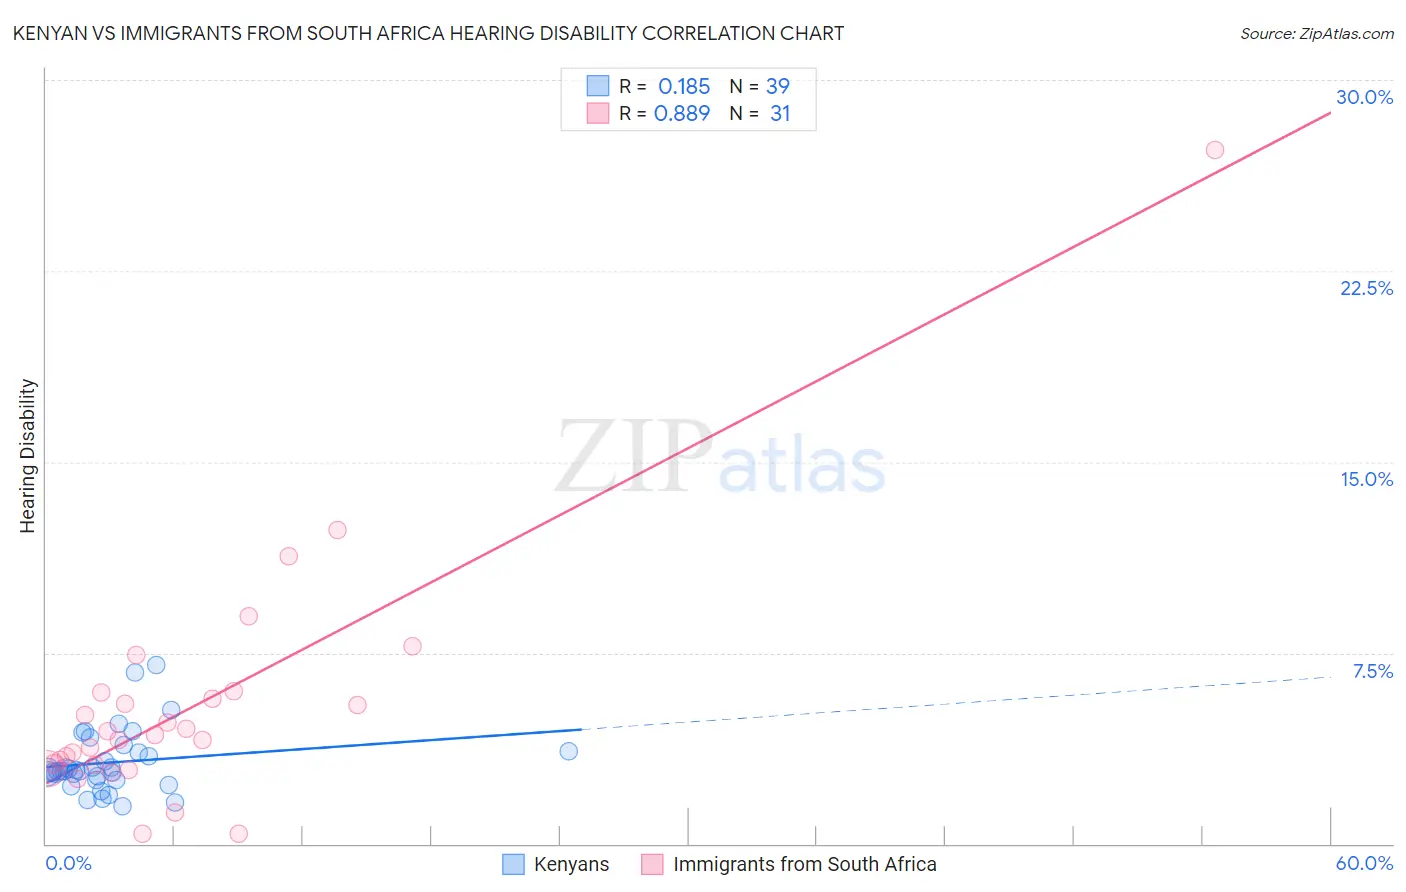
Kenyan vs Immigrants from South Africa Hearing Disability Correlation Chart
The statistical analysis conducted on geographies consisting of 168,202,963 people shows a poor positive correlation between the proportion of Kenyans and percentage of population with hearing disability in the United States with a correlation coefficient (R) of 0.185 and weighted average of 2.8%. Similarly, the statistical analysis conducted on geographies consisting of 233,290,036 people shows a very strong positive correlation between the proportion of Immigrants from South Africa and percentage of population with hearing disability in the United States with a correlation coefficient (R) of 0.889 and weighted average of 3.1%, a difference of 7.4%.
Hearing Disability Correlation Summary
| Measurement | Kenyan | Immigrants from South Africa |
| Minimum | 1.5% | 0.40% |
| Maximum | 7.0% | 27.3% |
| Range | 5.6% | 26.9% |
| Mean | 3.2% | 5.4% |
| Median | 2.9% | 4.3% |
| Interquartile 25% (IQ1) | 2.5% | 3.1% |
| Interquartile 75% (IQ3) | 3.6% | 6.0% |
| Interquartile Range (IQR) | 1.1% | 2.9% |
| Standard Deviation (Sample) | 1.2% | 4.9% |
| Standard Deviation (Population) | 1.2% | 4.8% |
Similar Demographics by Hearing Disability
Demographics Similar to Kenyans by Hearing Disability
In terms of hearing disability, the demographic groups most similar to Kenyans are Zimbabwean (2.8%, a difference of 0.020%), Immigrants from Liberia (2.8%, a difference of 0.030%), Jordanian (2.8%, a difference of 0.090%), Immigrants (2.8%, a difference of 0.12%), and Cuban (2.8%, a difference of 0.12%).
| Demographics | Rating | Rank | Hearing Disability |
| U.S. Virgin Islanders | 92.5 /100 | #112 | Exceptional 2.8% |
| Immigrants | Belarus | 91.6 /100 | #113 | Exceptional 2.8% |
| Cambodians | 91.1 /100 | #114 | Exceptional 2.8% |
| Immigrants | Latin America | 90.5 /100 | #115 | Exceptional 2.8% |
| Immigrants | Immigrants | 90.3 /100 | #116 | Exceptional 2.8% |
| Immigrants | Liberia | 90.0 /100 | #117 | Excellent 2.8% |
| Zimbabweans | 89.9 /100 | #118 | Excellent 2.8% |
| Kenyans | 89.8 /100 | #119 | Excellent 2.8% |
| Jordanians | 89.5 /100 | #120 | Excellent 2.8% |
| Cubans | 89.4 /100 | #121 | Excellent 2.8% |
| Liberians | 89.0 /100 | #122 | Excellent 2.8% |
| Immigrants | Zaire | 88.6 /100 | #123 | Excellent 2.9% |
| Bahamians | 88.6 /100 | #124 | Excellent 2.9% |
| Immigrants | Albania | 88.5 /100 | #125 | Excellent 2.9% |
| Immigrants | Sudan | 87.8 /100 | #126 | Excellent 2.9% |
Demographics Similar to Immigrants from South Africa by Hearing Disability
In terms of hearing disability, the demographic groups most similar to Immigrants from South Africa are African (3.0%, a difference of 0.19%), Immigrants from Switzerland (3.1%, a difference of 0.25%), Black/African American (3.0%, a difference of 0.38%), Mexican American Indian (3.0%, a difference of 0.38%), and Korean (3.1%, a difference of 0.38%).
| Demographics | Rating | Rank | Hearing Disability |
| Bulgarians | 39.7 /100 | #183 | Fair 3.0% |
| Immigrants | Ireland | 37.4 /100 | #184 | Fair 3.0% |
| Immigrants | Southern Europe | 35.3 /100 | #185 | Fair 3.0% |
| Immigrants | Mexico | 34.9 /100 | #186 | Fair 3.0% |
| Blacks/African Americans | 34.7 /100 | #187 | Fair 3.0% |
| Mexican American Indians | 34.7 /100 | #188 | Fair 3.0% |
| Africans | 32.9 /100 | #189 | Fair 3.0% |
| Immigrants | South Africa | 31.1 /100 | #190 | Fair 3.1% |
| Immigrants | Switzerland | 28.8 /100 | #191 | Fair 3.1% |
| Koreans | 27.6 /100 | #192 | Fair 3.1% |
| Macedonians | 27.0 /100 | #193 | Fair 3.1% |
| South Africans | 24.5 /100 | #194 | Fair 3.1% |
| Spanish American Indians | 24.1 /100 | #195 | Fair 3.1% |
| Immigrants | Europe | 22.9 /100 | #196 | Fair 3.1% |
| Immigrants | Bosnia and Herzegovina | 20.6 /100 | #197 | Fair 3.1% |