Kenyan vs Immigrants from Korea Male Disability
COMPARE
Kenyan
Immigrants from Korea
Male Disability
Male Disability Comparison
Kenyans
Immigrants from Korea
11.0%
MALE DISABILITY
78.1/ 100
METRIC RATING
144th/ 347
METRIC RANK
9.8%
MALE DISABILITY
100.0/ 100
METRIC RATING
17th/ 347
METRIC RANK
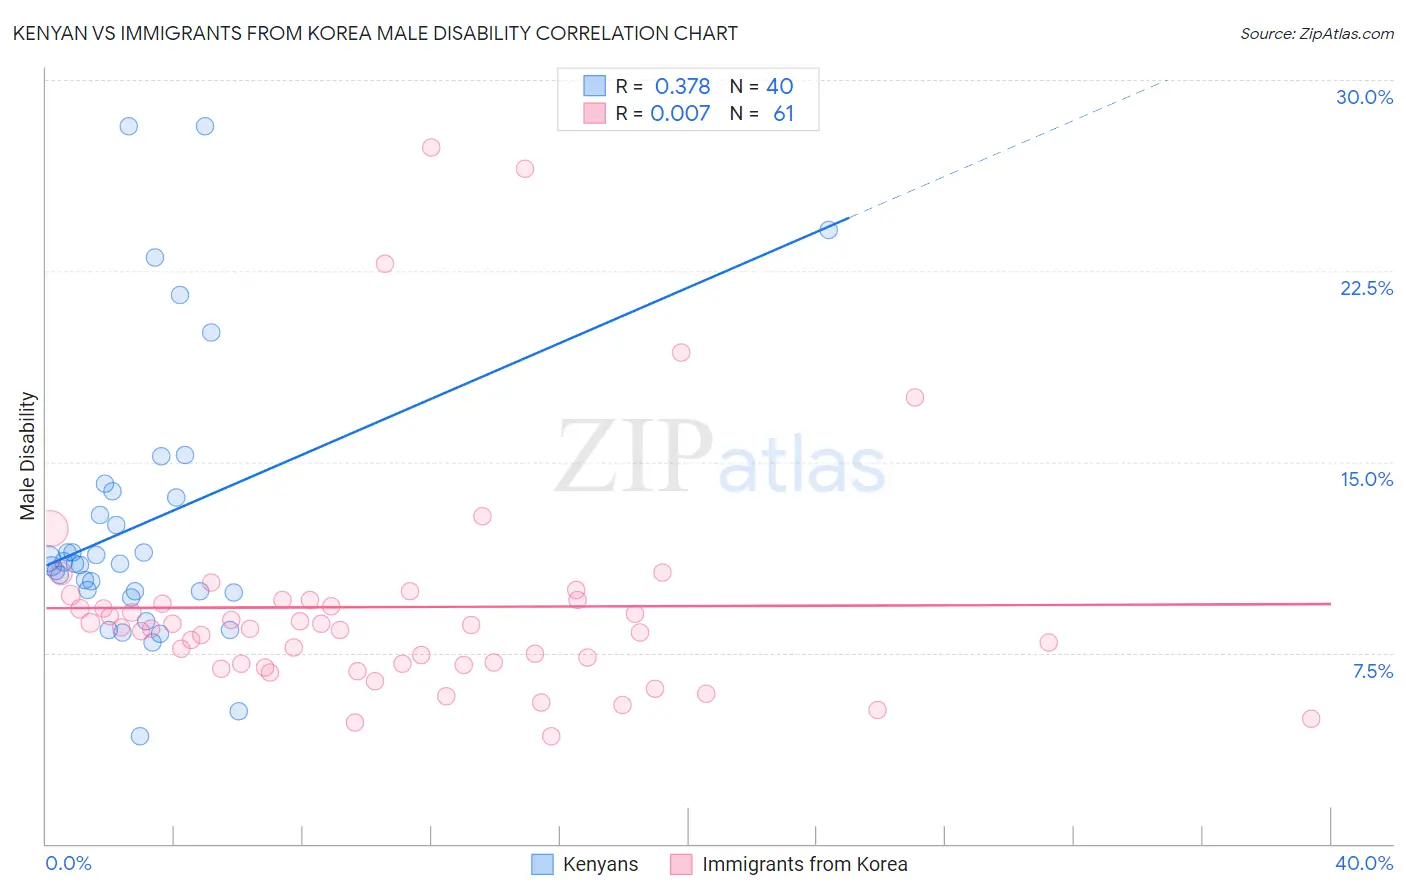
Kenyan vs Immigrants from Korea Male Disability Correlation Chart
The statistical analysis conducted on geographies consisting of 168,198,768 people shows a mild positive correlation between the proportion of Kenyans and percentage of males with a disability in the United States with a correlation coefficient (R) of 0.378 and weighted average of 11.0%. Similarly, the statistical analysis conducted on geographies consisting of 416,248,293 people shows no correlation between the proportion of Immigrants from Korea and percentage of males with a disability in the United States with a correlation coefficient (R) of 0.007 and weighted average of 9.8%, a difference of 12.6%.
Male Disability Correlation Summary
| Measurement | Kenyan | Immigrants from Korea |
| Minimum | 4.2% | 4.2% |
| Maximum | 28.2% | 27.3% |
| Range | 24.0% | 23.1% |
| Mean | 12.6% | 9.3% |
| Median | 11.0% | 8.5% |
| Interquartile 25% (IQ1) | 9.9% | 7.0% |
| Interquartile 75% (IQ3) | 13.7% | 9.6% |
| Interquartile Range (IQR) | 3.8% | 2.5% |
| Standard Deviation (Sample) | 5.5% | 4.5% |
| Standard Deviation (Population) | 5.5% | 4.5% |
Similar Demographics by Male Disability
Demographics Similar to Kenyans by Male Disability
In terms of male disability, the demographic groups most similar to Kenyans are Costa Rican (11.0%, a difference of 0.010%), Korean (11.0%, a difference of 0.050%), Immigrants from Croatia (11.0%, a difference of 0.070%), Sudanese (11.0%, a difference of 0.080%), and Immigrants from Denmark (11.0%, a difference of 0.14%).
| Demographics | Rating | Rank | Male Disability |
| Immigrants | Europe | 82.0 /100 | #137 | Excellent 11.0% |
| Nigerians | 81.9 /100 | #138 | Excellent 11.0% |
| South Africans | 81.7 /100 | #139 | Excellent 11.0% |
| Immigrants | Italy | 81.5 /100 | #140 | Excellent 11.0% |
| Arabs | 81.5 /100 | #141 | Excellent 11.0% |
| Immigrants | Sudan | 81.5 /100 | #142 | Excellent 11.0% |
| Moroccans | 80.7 /100 | #143 | Excellent 11.0% |
| Kenyans | 78.1 /100 | #144 | Good 11.0% |
| Costa Ricans | 78.0 /100 | #145 | Good 11.0% |
| Koreans | 77.5 /100 | #146 | Good 11.0% |
| Immigrants | Croatia | 77.3 /100 | #147 | Good 11.0% |
| Sudanese | 77.1 /100 | #148 | Good 11.0% |
| Immigrants | Denmark | 76.4 /100 | #149 | Good 11.0% |
| Immigrants | Guatemala | 75.1 /100 | #150 | Good 11.0% |
| Cubans | 74.9 /100 | #151 | Good 11.0% |
Demographics Similar to Immigrants from Korea by Male Disability
In terms of male disability, the demographic groups most similar to Immigrants from Korea are Okinawan (9.8%, a difference of 0.14%), Immigrants from Pakistan (9.8%, a difference of 0.56%), Indian (Asian) (9.7%, a difference of 0.75%), Immigrants from Iran (9.7%, a difference of 1.2%), and Iranian (9.7%, a difference of 1.3%).
| Demographics | Rating | Rank | Male Disability |
| Immigrants | Israel | 100.0 /100 | #10 | Exceptional 9.6% |
| Immigrants | Eastern Asia | 100.0 /100 | #11 | Exceptional 9.6% |
| Bolivians | 100.0 /100 | #12 | Exceptional 9.6% |
| Iranians | 100.0 /100 | #13 | Exceptional 9.7% |
| Immigrants | Iran | 100.0 /100 | #14 | Exceptional 9.7% |
| Indians (Asian) | 100.0 /100 | #15 | Exceptional 9.7% |
| Okinawans | 100.0 /100 | #16 | Exceptional 9.8% |
| Immigrants | Korea | 100.0 /100 | #17 | Exceptional 9.8% |
| Immigrants | Pakistan | 100.0 /100 | #18 | Exceptional 9.8% |
| Immigrants | Sri Lanka | 100.0 /100 | #19 | Exceptional 10.0% |
| Asians | 100.0 /100 | #20 | Exceptional 10.0% |
| Burmese | 100.0 /100 | #21 | Exceptional 10.0% |
| Immigrants | Venezuela | 100.0 /100 | #22 | Exceptional 10.0% |
| Cypriots | 100.0 /100 | #23 | Exceptional 10.0% |
| Immigrants | Asia | 100.0 /100 | #24 | Exceptional 10.0% |