Kenyan vs Immigrants from Belgium Cognitive Disability
COMPARE
Kenyan
Immigrants from Belgium
Cognitive Disability
Cognitive Disability Comparison
Kenyans
Immigrants from Belgium
18.1%
COGNITIVE DISABILITY
0.1/ 100
METRIC RATING
286th/ 347
METRIC RANK
16.7%
COGNITIVE DISABILITY
99.3/ 100
METRIC RATING
71st/ 347
METRIC RANK
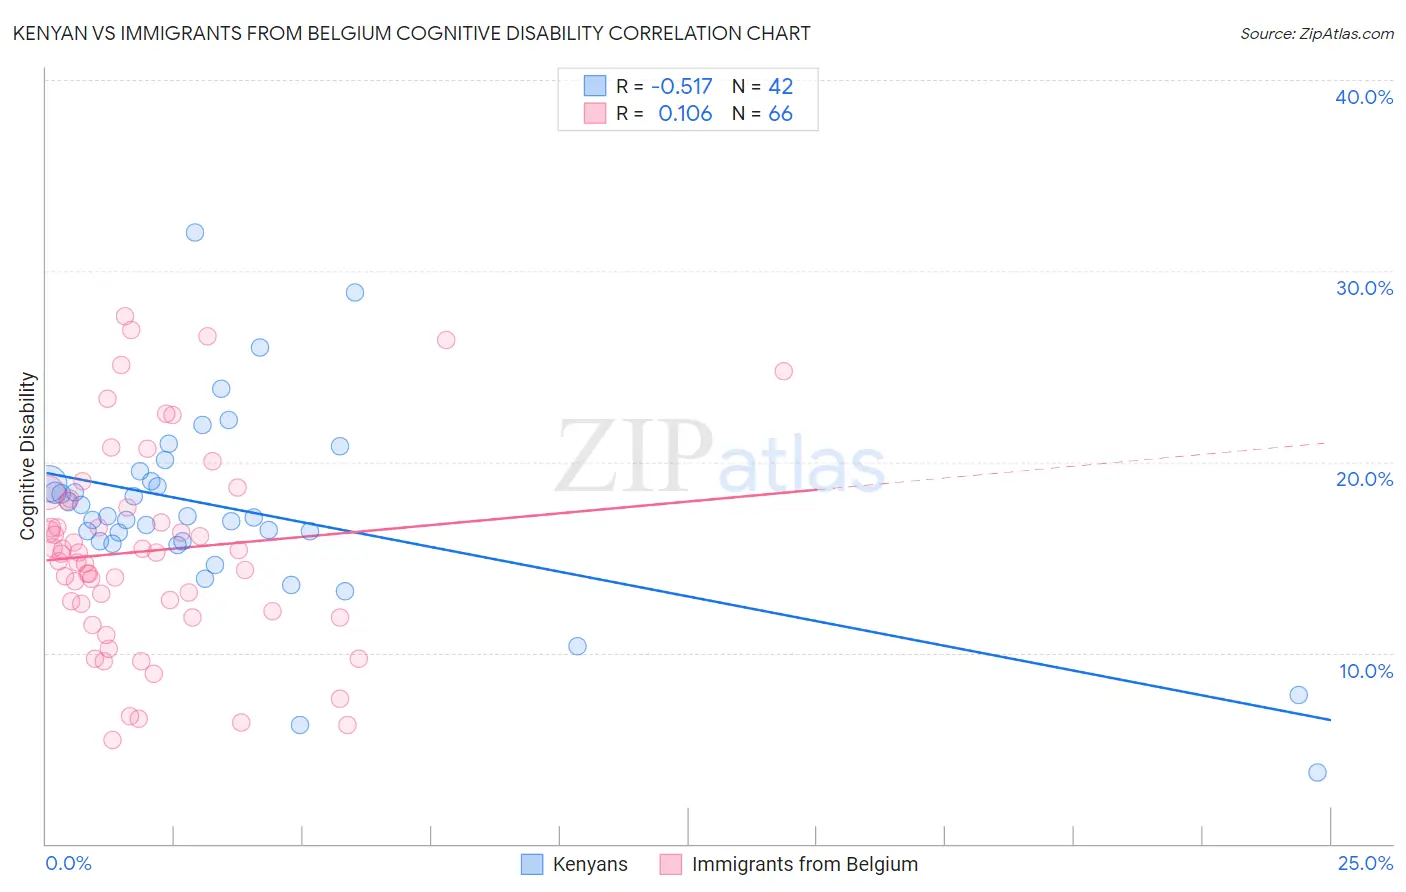
Kenyan vs Immigrants from Belgium Cognitive Disability Correlation Chart
The statistical analysis conducted on geographies consisting of 168,212,811 people shows a substantial negative correlation between the proportion of Kenyans and percentage of population with cognitive disability in the United States with a correlation coefficient (R) of -0.517 and weighted average of 18.1%. Similarly, the statistical analysis conducted on geographies consisting of 146,717,963 people shows a poor positive correlation between the proportion of Immigrants from Belgium and percentage of population with cognitive disability in the United States with a correlation coefficient (R) of 0.106 and weighted average of 16.7%, a difference of 8.8%.
Cognitive Disability Correlation Summary
| Measurement | Kenyan | Immigrants from Belgium |
| Minimum | 3.7% | 5.4% |
| Maximum | 32.0% | 27.7% |
| Range | 28.2% | 22.2% |
| Mean | 17.4% | 15.3% |
| Median | 17.1% | 15.2% |
| Interquartile 25% (IQ1) | 15.8% | 12.2% |
| Interquartile 75% (IQ3) | 19.0% | 17.9% |
| Interquartile Range (IQR) | 3.2% | 5.8% |
| Standard Deviation (Sample) | 5.1% | 5.3% |
| Standard Deviation (Population) | 5.1% | 5.2% |
Similar Demographics by Cognitive Disability
Demographics Similar to Kenyans by Cognitive Disability
In terms of cognitive disability, the demographic groups most similar to Kenyans are Bermudan (18.1%, a difference of 0.040%), Dutch West Indian (18.1%, a difference of 0.040%), Immigrants from Uganda (18.1%, a difference of 0.050%), Immigrants from West Indies (18.1%, a difference of 0.050%), and Native/Alaskan (18.1%, a difference of 0.060%).
| Demographics | Rating | Rank | Cognitive Disability |
| Chippewa | 0.1 /100 | #279 | Tragic 18.1% |
| West Indians | 0.1 /100 | #280 | Tragic 18.1% |
| Yakama | 0.1 /100 | #281 | Tragic 18.1% |
| Immigrants | Cambodia | 0.1 /100 | #282 | Tragic 18.1% |
| Nigerians | 0.1 /100 | #283 | Tragic 18.1% |
| Immigrants | Uganda | 0.1 /100 | #284 | Tragic 18.1% |
| Bermudans | 0.1 /100 | #285 | Tragic 18.1% |
| Kenyans | 0.1 /100 | #286 | Tragic 18.1% |
| Dutch West Indians | 0.1 /100 | #287 | Tragic 18.1% |
| Immigrants | West Indies | 0.1 /100 | #288 | Tragic 18.1% |
| Natives/Alaskans | 0.1 /100 | #289 | Tragic 18.1% |
| Immigrants | Africa | 0.1 /100 | #290 | Tragic 18.1% |
| Ottawa | 0.1 /100 | #291 | Tragic 18.2% |
| Iroquois | 0.1 /100 | #292 | Tragic 18.2% |
| Central American Indians | 0.1 /100 | #293 | Tragic 18.2% |
Demographics Similar to Immigrants from Belgium by Cognitive Disability
In terms of cognitive disability, the demographic groups most similar to Immigrants from Belgium are Immigrants from Sweden (16.7%, a difference of 0.010%), Immigrants from Uzbekistan (16.7%, a difference of 0.020%), German (16.7%, a difference of 0.020%), Burmese (16.7%, a difference of 0.020%), and Slavic (16.7%, a difference of 0.030%).
| Demographics | Rating | Rank | Cognitive Disability |
| Venezuelans | 99.6 /100 | #64 | Exceptional 16.6% |
| Colombians | 99.6 /100 | #65 | Exceptional 16.6% |
| Immigrants | Ukraine | 99.5 /100 | #66 | Exceptional 16.6% |
| Latvians | 99.5 /100 | #67 | Exceptional 16.6% |
| Ukrainians | 99.4 /100 | #68 | Exceptional 16.6% |
| Immigrants | Uzbekistan | 99.4 /100 | #69 | Exceptional 16.7% |
| Immigrants | Sweden | 99.4 /100 | #70 | Exceptional 16.7% |
| Immigrants | Belgium | 99.3 /100 | #71 | Exceptional 16.7% |
| Germans | 99.3 /100 | #72 | Exceptional 16.7% |
| Burmese | 99.3 /100 | #73 | Exceptional 16.7% |
| Slavs | 99.3 /100 | #74 | Exceptional 16.7% |
| Estonians | 99.3 /100 | #75 | Exceptional 16.7% |
| Immigrants | Serbia | 99.3 /100 | #76 | Exceptional 16.7% |
| Immigrants | Hungary | 99.3 /100 | #77 | Exceptional 16.7% |
| Peruvians | 99.3 /100 | #78 | Exceptional 16.7% |