Immigrants from Switzerland vs Carpatho Rusyn Cognitive Disability
COMPARE
Immigrants from Switzerland
Carpatho Rusyn
Cognitive Disability
Cognitive Disability Comparison
Immigrants from Switzerland
Carpatho Rusyns
17.2%
COGNITIVE DISABILITY
71.5/ 100
METRIC RATING
163rd/ 347
METRIC RANK
17.0%
COGNITIVE DISABILITY
89.6/ 100
METRIC RATING
142nd/ 347
METRIC RANK
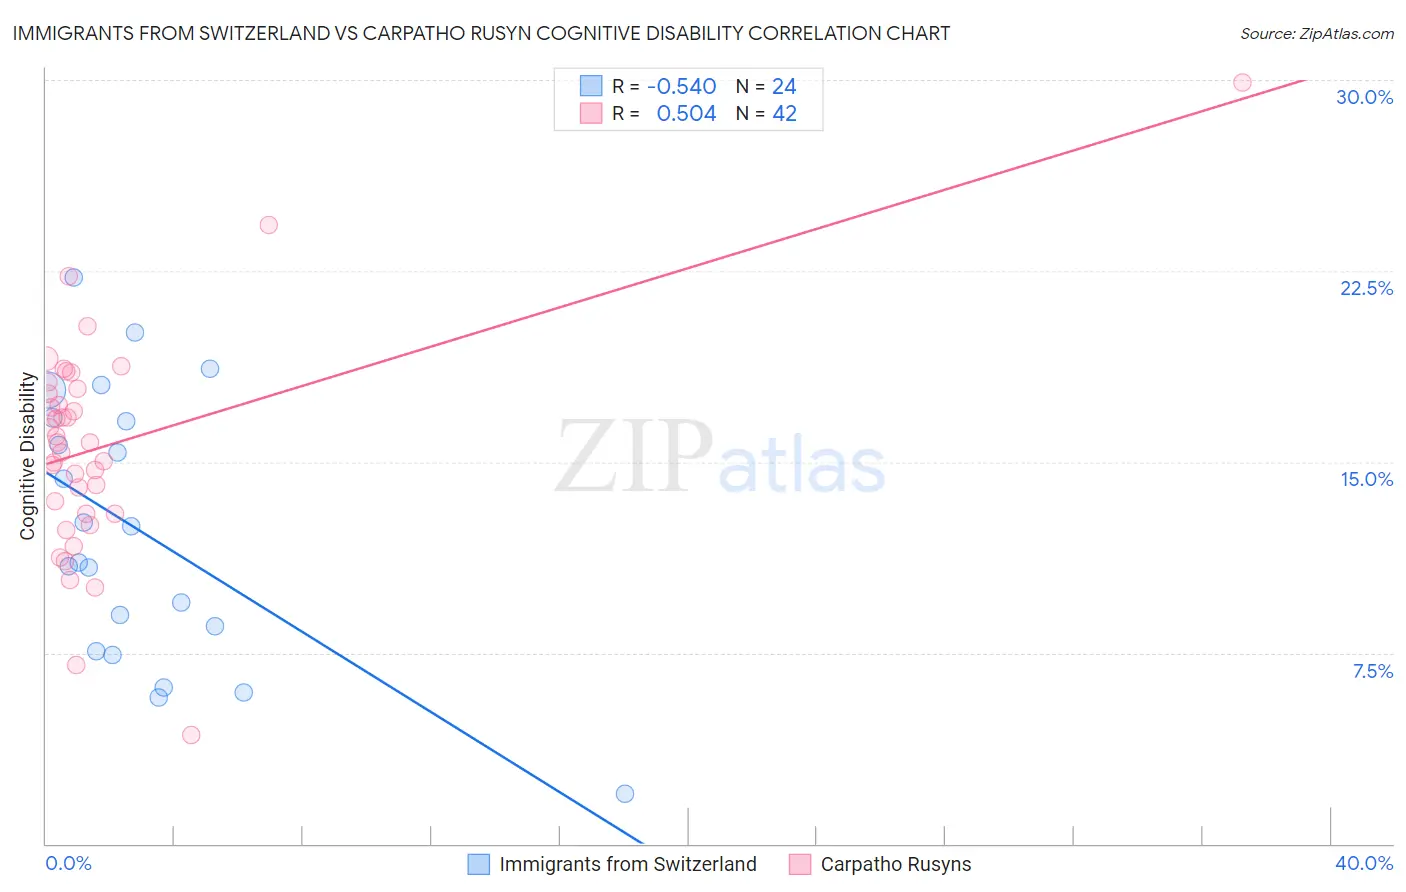
Immigrants from Switzerland vs Carpatho Rusyn Cognitive Disability Correlation Chart
The statistical analysis conducted on geographies consisting of 148,077,792 people shows a substantial negative correlation between the proportion of Immigrants from Switzerland and percentage of population with cognitive disability in the United States with a correlation coefficient (R) of -0.540 and weighted average of 17.2%. Similarly, the statistical analysis conducted on geographies consisting of 58,872,415 people shows a substantial positive correlation between the proportion of Carpatho Rusyns and percentage of population with cognitive disability in the United States with a correlation coefficient (R) of 0.504 and weighted average of 17.0%, a difference of 0.89%.
Cognitive Disability Correlation Summary
| Measurement | Immigrants from Switzerland | Carpatho Rusyn |
| Minimum | 2.0% | 4.3% |
| Maximum | 22.2% | 29.9% |
| Range | 20.3% | 25.6% |
| Mean | 12.3% | 15.6% |
| Median | 11.8% | 15.8% |
| Interquartile 25% (IQ1) | 8.0% | 13.0% |
| Interquartile 75% (IQ3) | 16.7% | 17.9% |
| Interquartile Range (IQR) | 8.6% | 4.9% |
| Standard Deviation (Sample) | 5.3% | 4.4% |
| Standard Deviation (Population) | 5.2% | 4.3% |
Similar Demographics by Cognitive Disability
Demographics Similar to Immigrants from Switzerland by Cognitive Disability
In terms of cognitive disability, the demographic groups most similar to Immigrants from Switzerland are Yugoslavian (17.2%, a difference of 0.0%), American (17.2%, a difference of 0.020%), Australian (17.2%, a difference of 0.030%), Armenian (17.2%, a difference of 0.050%), and Immigrants from Latvia (17.2%, a difference of 0.060%).
| Demographics | Rating | Rank | Cognitive Disability |
| Sri Lankans | 78.9 /100 | #156 | Good 17.1% |
| Immigrants | Australia | 76.0 /100 | #157 | Good 17.1% |
| Celtics | 74.1 /100 | #158 | Good 17.1% |
| Immigrants | Latvia | 73.2 /100 | #159 | Good 17.2% |
| Australians | 72.4 /100 | #160 | Good 17.2% |
| Americans | 72.2 /100 | #161 | Good 17.2% |
| Yugoslavians | 71.6 /100 | #162 | Good 17.2% |
| Immigrants | Switzerland | 71.5 /100 | #163 | Good 17.2% |
| Armenians | 70.1 /100 | #164 | Good 17.2% |
| Immigrants | Albania | 64.9 /100 | #165 | Good 17.2% |
| Immigrants | Ecuador | 64.4 /100 | #166 | Good 17.2% |
| Immigrants | Syria | 63.5 /100 | #167 | Good 17.2% |
| Immigrants | Immigrants | 62.5 /100 | #168 | Good 17.2% |
| Immigrants | Portugal | 61.8 /100 | #169 | Good 17.2% |
| Ecuadorians | 59.6 /100 | #170 | Average 17.2% |
Demographics Similar to Carpatho Rusyns by Cognitive Disability
In terms of cognitive disability, the demographic groups most similar to Carpatho Rusyns are Aleut (17.0%, a difference of 0.020%), British (17.0%, a difference of 0.020%), Immigrants from Brazil (17.0%, a difference of 0.020%), French (17.0%, a difference of 0.030%), and Chilean (17.0%, a difference of 0.030%).
| Demographics | Rating | Rank | Cognitive Disability |
| Lebanese | 91.3 /100 | #135 | Exceptional 17.0% |
| Israelis | 91.0 /100 | #136 | Exceptional 17.0% |
| Immigrants | Norway | 90.9 /100 | #137 | Exceptional 17.0% |
| Welsh | 90.8 /100 | #138 | Exceptional 17.0% |
| French | 90.0 /100 | #139 | Excellent 17.0% |
| Chileans | 89.9 /100 | #140 | Excellent 17.0% |
| Aleuts | 89.9 /100 | #141 | Excellent 17.0% |
| Carpatho Rusyns | 89.6 /100 | #142 | Excellent 17.0% |
| British | 89.3 /100 | #143 | Excellent 17.0% |
| Immigrants | Brazil | 89.3 /100 | #144 | Excellent 17.0% |
| Immigrants | South Eastern Asia | 88.7 /100 | #145 | Excellent 17.0% |
| Costa Ricans | 88.0 /100 | #146 | Excellent 17.0% |
| Scotch-Irish | 85.9 /100 | #147 | Excellent 17.1% |
| French Canadians | 85.7 /100 | #148 | Excellent 17.1% |
| Cypriots | 85.7 /100 | #149 | Excellent 17.1% |