Kenyan vs Lithuanian Cognitive Disability
COMPARE
Kenyan
Lithuanian
Cognitive Disability
Cognitive Disability Comparison
Kenyans
Lithuanians
18.1%
COGNITIVE DISABILITY
0.1/ 100
METRIC RATING
286th/ 347
METRIC RANK
16.3%
COGNITIVE DISABILITY
100.0/ 100
METRIC RATING
13th/ 347
METRIC RANK
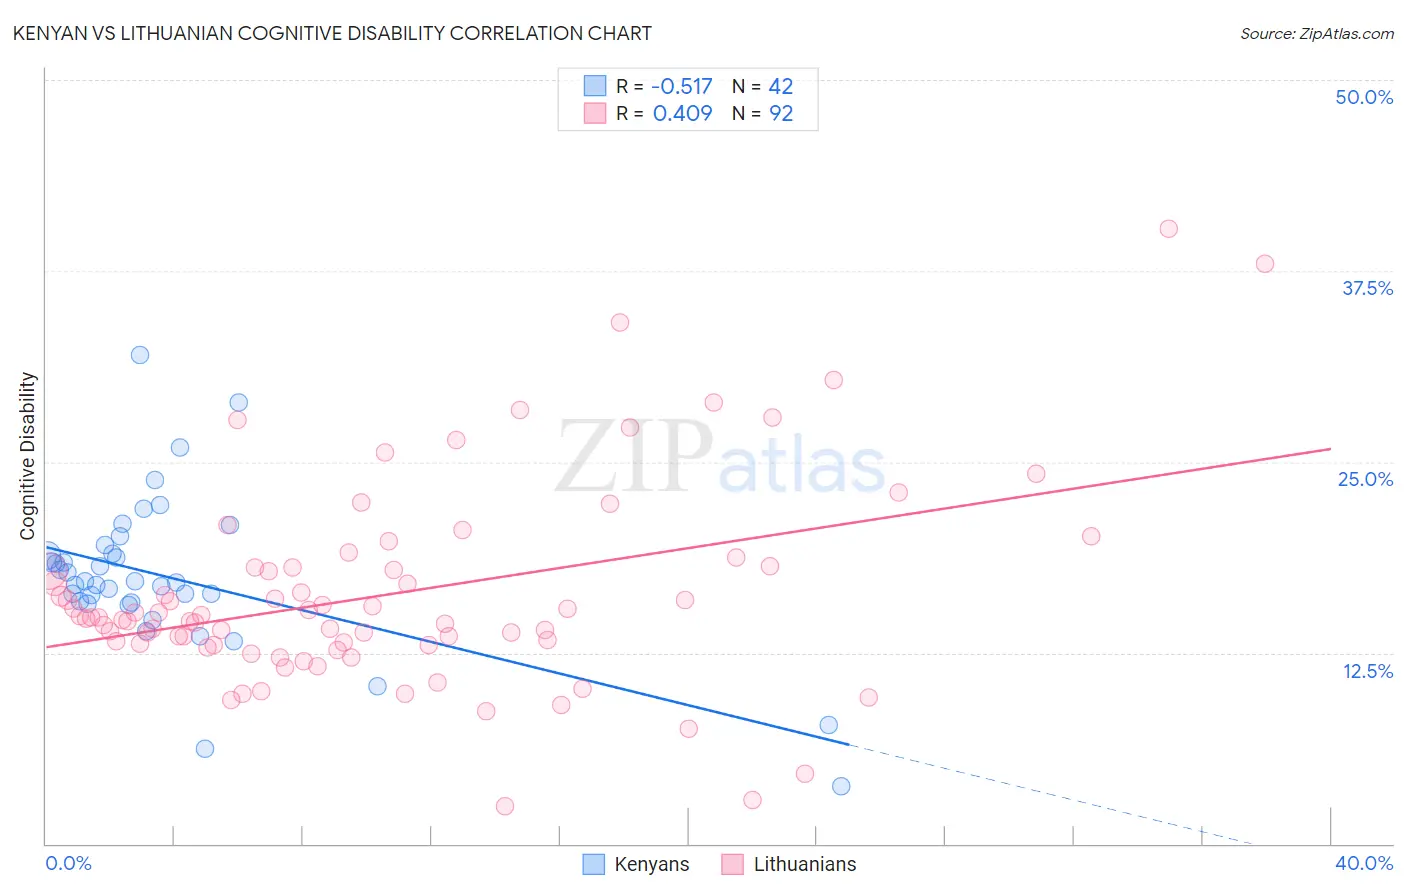
Kenyan vs Lithuanian Cognitive Disability Correlation Chart
The statistical analysis conducted on geographies consisting of 168,212,811 people shows a substantial negative correlation between the proportion of Kenyans and percentage of population with cognitive disability in the United States with a correlation coefficient (R) of -0.517 and weighted average of 18.1%. Similarly, the statistical analysis conducted on geographies consisting of 421,943,876 people shows a moderate positive correlation between the proportion of Lithuanians and percentage of population with cognitive disability in the United States with a correlation coefficient (R) of 0.409 and weighted average of 16.3%, a difference of 11.6%.
Cognitive Disability Correlation Summary
| Measurement | Kenyan | Lithuanian |
| Minimum | 3.7% | 2.5% |
| Maximum | 32.0% | 40.3% |
| Range | 28.2% | 37.8% |
| Mean | 17.4% | 16.3% |
| Median | 17.1% | 14.8% |
| Interquartile 25% (IQ1) | 15.8% | 13.1% |
| Interquartile 75% (IQ3) | 19.0% | 18.1% |
| Interquartile Range (IQR) | 3.2% | 5.0% |
| Standard Deviation (Sample) | 5.1% | 6.6% |
| Standard Deviation (Population) | 5.1% | 6.6% |
Similar Demographics by Cognitive Disability
Demographics Similar to Kenyans by Cognitive Disability
In terms of cognitive disability, the demographic groups most similar to Kenyans are Bermudan (18.1%, a difference of 0.040%), Dutch West Indian (18.1%, a difference of 0.040%), Immigrants from Uganda (18.1%, a difference of 0.050%), Immigrants from West Indies (18.1%, a difference of 0.050%), and Native/Alaskan (18.1%, a difference of 0.060%).
| Demographics | Rating | Rank | Cognitive Disability |
| Chippewa | 0.1 /100 | #279 | Tragic 18.1% |
| West Indians | 0.1 /100 | #280 | Tragic 18.1% |
| Yakama | 0.1 /100 | #281 | Tragic 18.1% |
| Immigrants | Cambodia | 0.1 /100 | #282 | Tragic 18.1% |
| Nigerians | 0.1 /100 | #283 | Tragic 18.1% |
| Immigrants | Uganda | 0.1 /100 | #284 | Tragic 18.1% |
| Bermudans | 0.1 /100 | #285 | Tragic 18.1% |
| Kenyans | 0.1 /100 | #286 | Tragic 18.1% |
| Dutch West Indians | 0.1 /100 | #287 | Tragic 18.1% |
| Immigrants | West Indies | 0.1 /100 | #288 | Tragic 18.1% |
| Natives/Alaskans | 0.1 /100 | #289 | Tragic 18.1% |
| Immigrants | Africa | 0.1 /100 | #290 | Tragic 18.1% |
| Ottawa | 0.1 /100 | #291 | Tragic 18.2% |
| Iroquois | 0.1 /100 | #292 | Tragic 18.2% |
| Central American Indians | 0.1 /100 | #293 | Tragic 18.2% |
Demographics Similar to Lithuanians by Cognitive Disability
In terms of cognitive disability, the demographic groups most similar to Lithuanians are Immigrants from Austria (16.3%, a difference of 0.060%), Maltese (16.2%, a difference of 0.090%), Immigrants from Greece (16.3%, a difference of 0.090%), Immigrants from Czechoslovakia (16.2%, a difference of 0.25%), and Immigrants from Scotland (16.2%, a difference of 0.34%).
| Demographics | Rating | Rank | Cognitive Disability |
| Thais | 100.0 /100 | #6 | Exceptional 16.1% |
| Immigrants | Ireland | 100.0 /100 | #7 | Exceptional 16.1% |
| Immigrants | Poland | 100.0 /100 | #8 | Exceptional 16.1% |
| Assyrians/Chaldeans/Syriacs | 100.0 /100 | #9 | Exceptional 16.2% |
| Immigrants | Scotland | 100.0 /100 | #10 | Exceptional 16.2% |
| Immigrants | Czechoslovakia | 100.0 /100 | #11 | Exceptional 16.2% |
| Maltese | 100.0 /100 | #12 | Exceptional 16.2% |
| Lithuanians | 100.0 /100 | #13 | Exceptional 16.3% |
| Immigrants | Austria | 100.0 /100 | #14 | Exceptional 16.3% |
| Immigrants | Greece | 100.0 /100 | #15 | Exceptional 16.3% |
| Eastern Europeans | 100.0 /100 | #16 | Exceptional 16.3% |
| Immigrants | North Macedonia | 100.0 /100 | #17 | Exceptional 16.3% |
| Immigrants | Northern Europe | 100.0 /100 | #18 | Exceptional 16.3% |
| Immigrants | Bolivia | 100.0 /100 | #19 | Exceptional 16.3% |
| Bulgarians | 100.0 /100 | #20 | Exceptional 16.3% |