Kenyan vs Immigrants from Albania Cognitive Disability
COMPARE
Kenyan
Immigrants from Albania
Cognitive Disability
Cognitive Disability Comparison
Kenyans
Immigrants from Albania
18.1%
COGNITIVE DISABILITY
0.1/ 100
METRIC RATING
286th/ 347
METRIC RANK
17.2%
COGNITIVE DISABILITY
64.9/ 100
METRIC RATING
165th/ 347
METRIC RANK
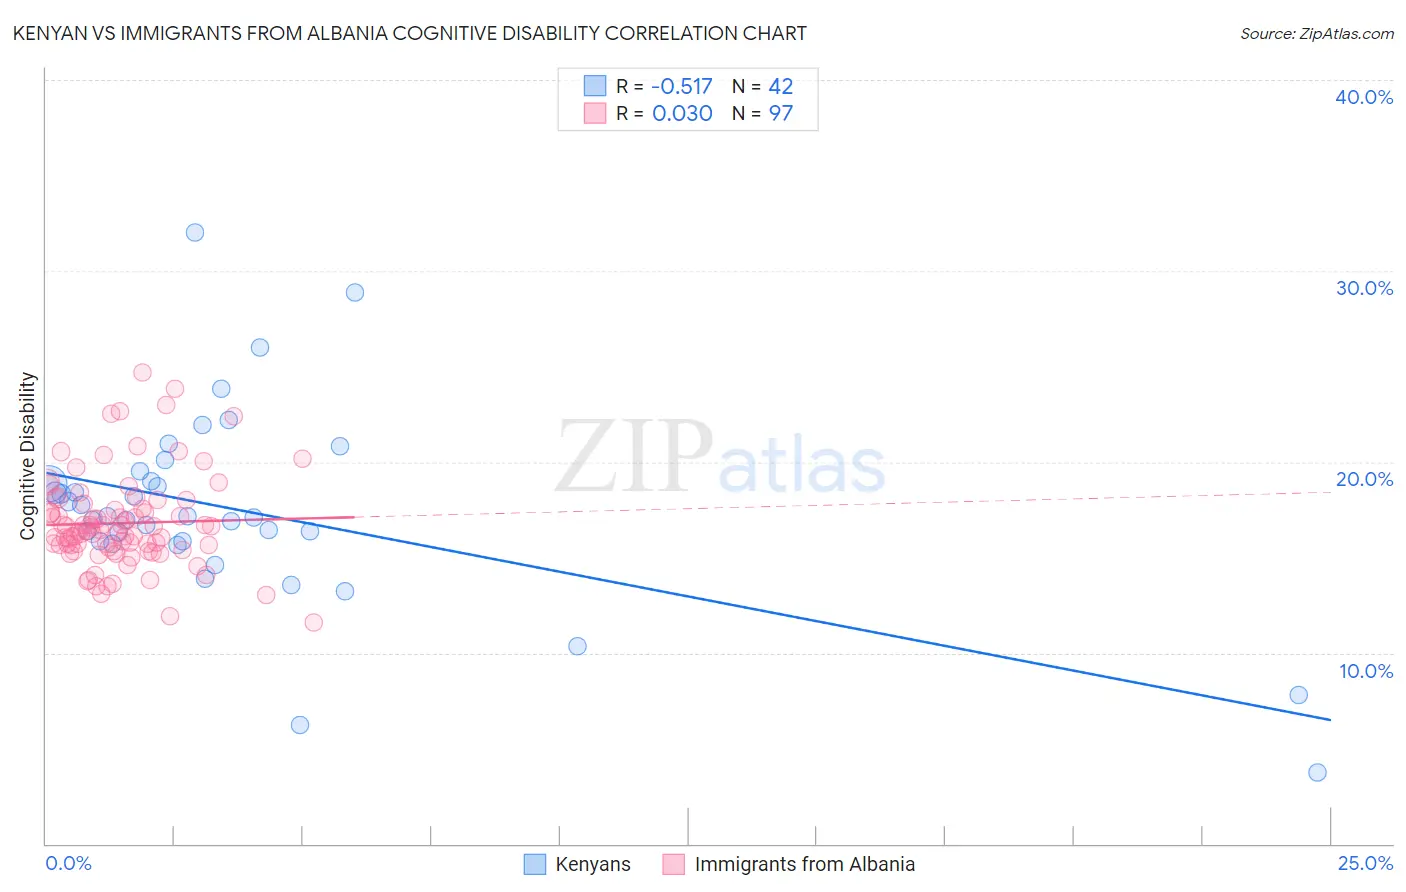
Kenyan vs Immigrants from Albania Cognitive Disability Correlation Chart
The statistical analysis conducted on geographies consisting of 168,212,811 people shows a substantial negative correlation between the proportion of Kenyans and percentage of population with cognitive disability in the United States with a correlation coefficient (R) of -0.517 and weighted average of 18.1%. Similarly, the statistical analysis conducted on geographies consisting of 119,394,902 people shows no correlation between the proportion of Immigrants from Albania and percentage of population with cognitive disability in the United States with a correlation coefficient (R) of 0.030 and weighted average of 17.2%, a difference of 5.4%.
Cognitive Disability Correlation Summary
| Measurement | Kenyan | Immigrants from Albania |
| Minimum | 3.7% | 11.6% |
| Maximum | 32.0% | 24.7% |
| Range | 28.2% | 13.2% |
| Mean | 17.4% | 16.8% |
| Median | 17.1% | 16.4% |
| Interquartile 25% (IQ1) | 15.8% | 15.5% |
| Interquartile 75% (IQ3) | 19.0% | 17.7% |
| Interquartile Range (IQR) | 3.2% | 2.2% |
| Standard Deviation (Sample) | 5.1% | 2.4% |
| Standard Deviation (Population) | 5.1% | 2.4% |
Similar Demographics by Cognitive Disability
Demographics Similar to Kenyans by Cognitive Disability
In terms of cognitive disability, the demographic groups most similar to Kenyans are Bermudan (18.1%, a difference of 0.040%), Dutch West Indian (18.1%, a difference of 0.040%), Immigrants from Uganda (18.1%, a difference of 0.050%), Immigrants from West Indies (18.1%, a difference of 0.050%), and Native/Alaskan (18.1%, a difference of 0.060%).
| Demographics | Rating | Rank | Cognitive Disability |
| Chippewa | 0.1 /100 | #279 | Tragic 18.1% |
| West Indians | 0.1 /100 | #280 | Tragic 18.1% |
| Yakama | 0.1 /100 | #281 | Tragic 18.1% |
| Immigrants | Cambodia | 0.1 /100 | #282 | Tragic 18.1% |
| Nigerians | 0.1 /100 | #283 | Tragic 18.1% |
| Immigrants | Uganda | 0.1 /100 | #284 | Tragic 18.1% |
| Bermudans | 0.1 /100 | #285 | Tragic 18.1% |
| Kenyans | 0.1 /100 | #286 | Tragic 18.1% |
| Dutch West Indians | 0.1 /100 | #287 | Tragic 18.1% |
| Immigrants | West Indies | 0.1 /100 | #288 | Tragic 18.1% |
| Natives/Alaskans | 0.1 /100 | #289 | Tragic 18.1% |
| Immigrants | Africa | 0.1 /100 | #290 | Tragic 18.1% |
| Ottawa | 0.1 /100 | #291 | Tragic 18.2% |
| Iroquois | 0.1 /100 | #292 | Tragic 18.2% |
| Central American Indians | 0.1 /100 | #293 | Tragic 18.2% |
Demographics Similar to Immigrants from Albania by Cognitive Disability
In terms of cognitive disability, the demographic groups most similar to Immigrants from Albania are Immigrants from Ecuador (17.2%, a difference of 0.010%), Immigrants from Syria (17.2%, a difference of 0.040%), Immigrants (17.2%, a difference of 0.070%), Immigrants from Portugal (17.2%, a difference of 0.090%), and Ecuadorian (17.2%, a difference of 0.16%).
| Demographics | Rating | Rank | Cognitive Disability |
| Celtics | 74.1 /100 | #158 | Good 17.1% |
| Immigrants | Latvia | 73.2 /100 | #159 | Good 17.2% |
| Australians | 72.4 /100 | #160 | Good 17.2% |
| Americans | 72.2 /100 | #161 | Good 17.2% |
| Yugoslavians | 71.6 /100 | #162 | Good 17.2% |
| Immigrants | Switzerland | 71.5 /100 | #163 | Good 17.2% |
| Armenians | 70.1 /100 | #164 | Good 17.2% |
| Immigrants | Albania | 64.9 /100 | #165 | Good 17.2% |
| Immigrants | Ecuador | 64.4 /100 | #166 | Good 17.2% |
| Immigrants | Syria | 63.5 /100 | #167 | Good 17.2% |
| Immigrants | Immigrants | 62.5 /100 | #168 | Good 17.2% |
| Immigrants | Portugal | 61.8 /100 | #169 | Good 17.2% |
| Ecuadorians | 59.6 /100 | #170 | Average 17.2% |
| Tlingit-Haida | 59.4 /100 | #171 | Average 17.2% |
| Immigrants | Turkey | 56.7 /100 | #172 | Average 17.2% |