Jordanian vs Malaysian Vision Disability
COMPARE
Jordanian
Malaysian
Vision Disability
Vision Disability Comparison
Jordanians
Malaysians
2.0%
VISION DISABILITY
99.2/ 100
METRIC RATING
56th/ 347
METRIC RANK
2.3%
VISION DISABILITY
0.9/ 100
METRIC RATING
241st/ 347
METRIC RANK
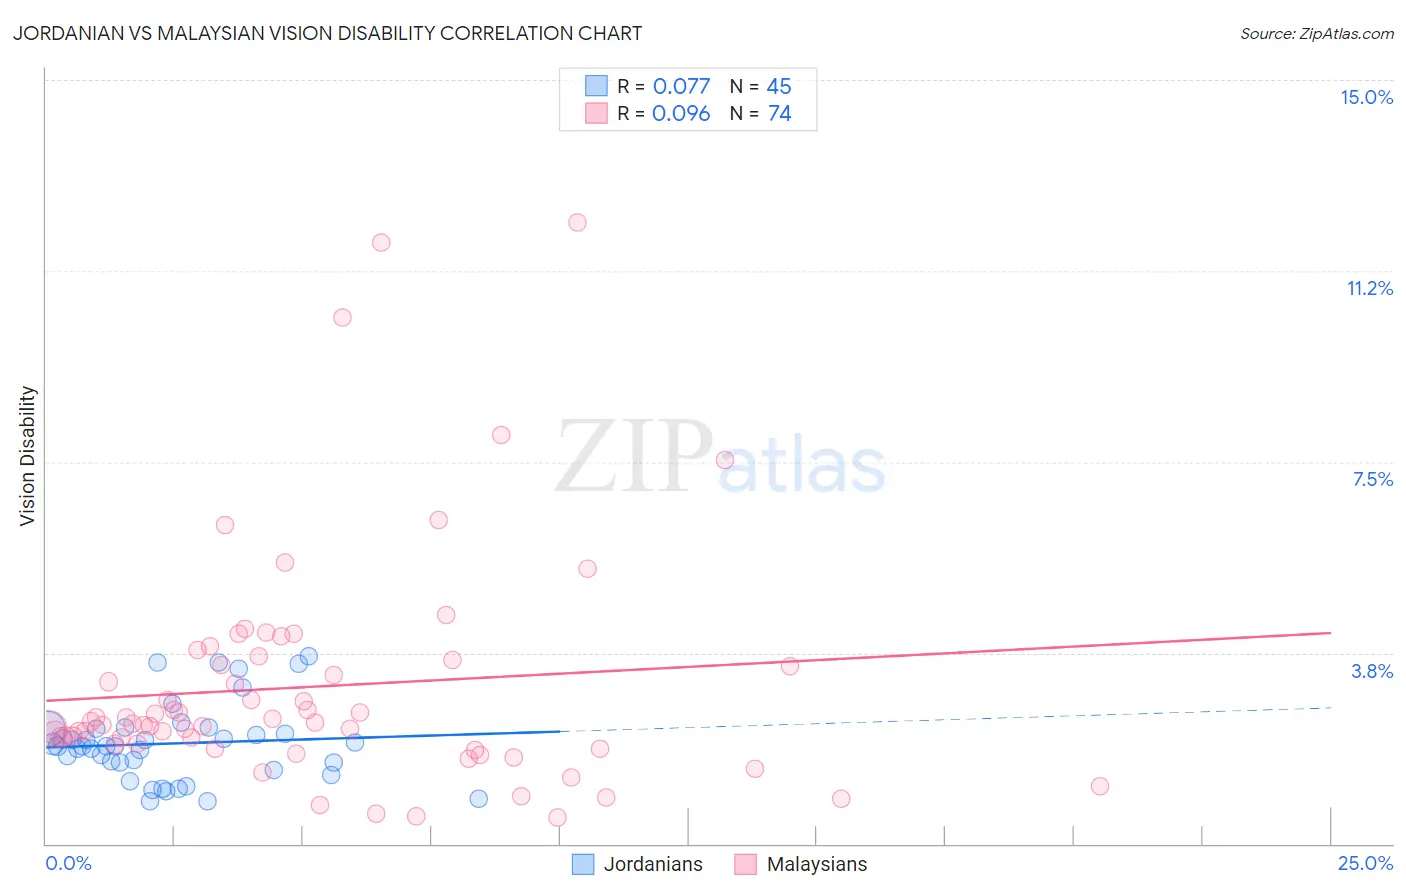
Jordanian vs Malaysian Vision Disability Correlation Chart
The statistical analysis conducted on geographies consisting of 166,387,634 people shows a slight positive correlation between the proportion of Jordanians and percentage of population with vision disability in the United States with a correlation coefficient (R) of 0.077 and weighted average of 2.0%. Similarly, the statistical analysis conducted on geographies consisting of 226,017,600 people shows a slight positive correlation between the proportion of Malaysians and percentage of population with vision disability in the United States with a correlation coefficient (R) of 0.096 and weighted average of 2.3%, a difference of 16.3%.
Vision Disability Correlation Summary
| Measurement | Jordanian | Malaysian |
| Minimum | 0.83% | 0.52% |
| Maximum | 3.7% | 12.2% |
| Range | 2.8% | 11.7% |
| Mean | 2.0% | 3.1% |
| Median | 1.9% | 2.4% |
| Interquartile 25% (IQ1) | 1.5% | 2.0% |
| Interquartile 75% (IQ3) | 2.3% | 3.6% |
| Interquartile Range (IQR) | 0.74% | 1.6% |
| Standard Deviation (Sample) | 0.75% | 2.3% |
| Standard Deviation (Population) | 0.74% | 2.3% |
Similar Demographics by Vision Disability
Demographics Similar to Jordanians by Vision Disability
In terms of vision disability, the demographic groups most similar to Jordanians are Somali (2.0%, a difference of 0.020%), Immigrants from Saudi Arabia (2.0%, a difference of 0.090%), Laotian (2.0%, a difference of 0.17%), Macedonian (2.0%, a difference of 0.22%), and Argentinean (2.0%, a difference of 0.23%).
| Demographics | Rating | Rank | Vision Disability |
| Latvians | 99.5 /100 | #49 | Exceptional 2.0% |
| Afghans | 99.5 /100 | #50 | Exceptional 2.0% |
| Tongans | 99.5 /100 | #51 | Exceptional 2.0% |
| Immigrants | Serbia | 99.4 /100 | #52 | Exceptional 2.0% |
| Immigrants | Belarus | 99.3 /100 | #53 | Exceptional 2.0% |
| Macedonians | 99.3 /100 | #54 | Exceptional 2.0% |
| Laotians | 99.3 /100 | #55 | Exceptional 2.0% |
| Jordanians | 99.2 /100 | #56 | Exceptional 2.0% |
| Somalis | 99.2 /100 | #57 | Exceptional 2.0% |
| Immigrants | Saudi Arabia | 99.2 /100 | #58 | Exceptional 2.0% |
| Argentineans | 99.1 /100 | #59 | Exceptional 2.0% |
| Immigrants | Romania | 99.1 /100 | #60 | Exceptional 2.0% |
| Immigrants | Belgium | 99.1 /100 | #61 | Exceptional 2.0% |
| Immigrants | Russia | 99.1 /100 | #62 | Exceptional 2.0% |
| Armenians | 99.0 /100 | #63 | Exceptional 2.0% |
Demographics Similar to Malaysians by Vision Disability
In terms of vision disability, the demographic groups most similar to Malaysians are Panamanian (2.3%, a difference of 0.030%), Immigrants from Panama (2.3%, a difference of 0.14%), English (2.3%, a difference of 0.29%), Immigrants from Cambodia (2.3%, a difference of 0.30%), and Immigrants from Portugal (2.3%, a difference of 0.57%).
| Demographics | Rating | Rank | Vision Disability |
| Scottish | 1.6 /100 | #234 | Tragic 2.3% |
| Marshallese | 1.5 /100 | #235 | Tragic 2.3% |
| Immigrants | Congo | 1.4 /100 | #236 | Tragic 2.3% |
| Immigrants | Portugal | 1.4 /100 | #237 | Tragic 2.3% |
| Immigrants | Cambodia | 1.1 /100 | #238 | Tragic 2.3% |
| English | 1.1 /100 | #239 | Tragic 2.3% |
| Panamanians | 0.9 /100 | #240 | Tragic 2.3% |
| Malaysians | 0.9 /100 | #241 | Tragic 2.3% |
| Immigrants | Panama | 0.8 /100 | #242 | Tragic 2.3% |
| Immigrants | Nicaragua | 0.6 /100 | #243 | Tragic 2.3% |
| Immigrants | West Indies | 0.6 /100 | #244 | Tragic 2.3% |
| Alsatians | 0.6 /100 | #245 | Tragic 2.3% |
| French | 0.5 /100 | #246 | Tragic 2.3% |
| Guatemalans | 0.5 /100 | #247 | Tragic 2.3% |
| Sub-Saharan Africans | 0.5 /100 | #248 | Tragic 2.3% |