Jordanian vs Immigrants from South America Vision Disability
COMPARE
Jordanian
Immigrants from South America
Vision Disability
Vision Disability Comparison
Jordanians
Immigrants from South America
2.0%
VISION DISABILITY
99.2/ 100
METRIC RATING
56th/ 347
METRIC RANK
2.1%
VISION DISABILITY
73.8/ 100
METRIC RATING
153rd/ 347
METRIC RANK
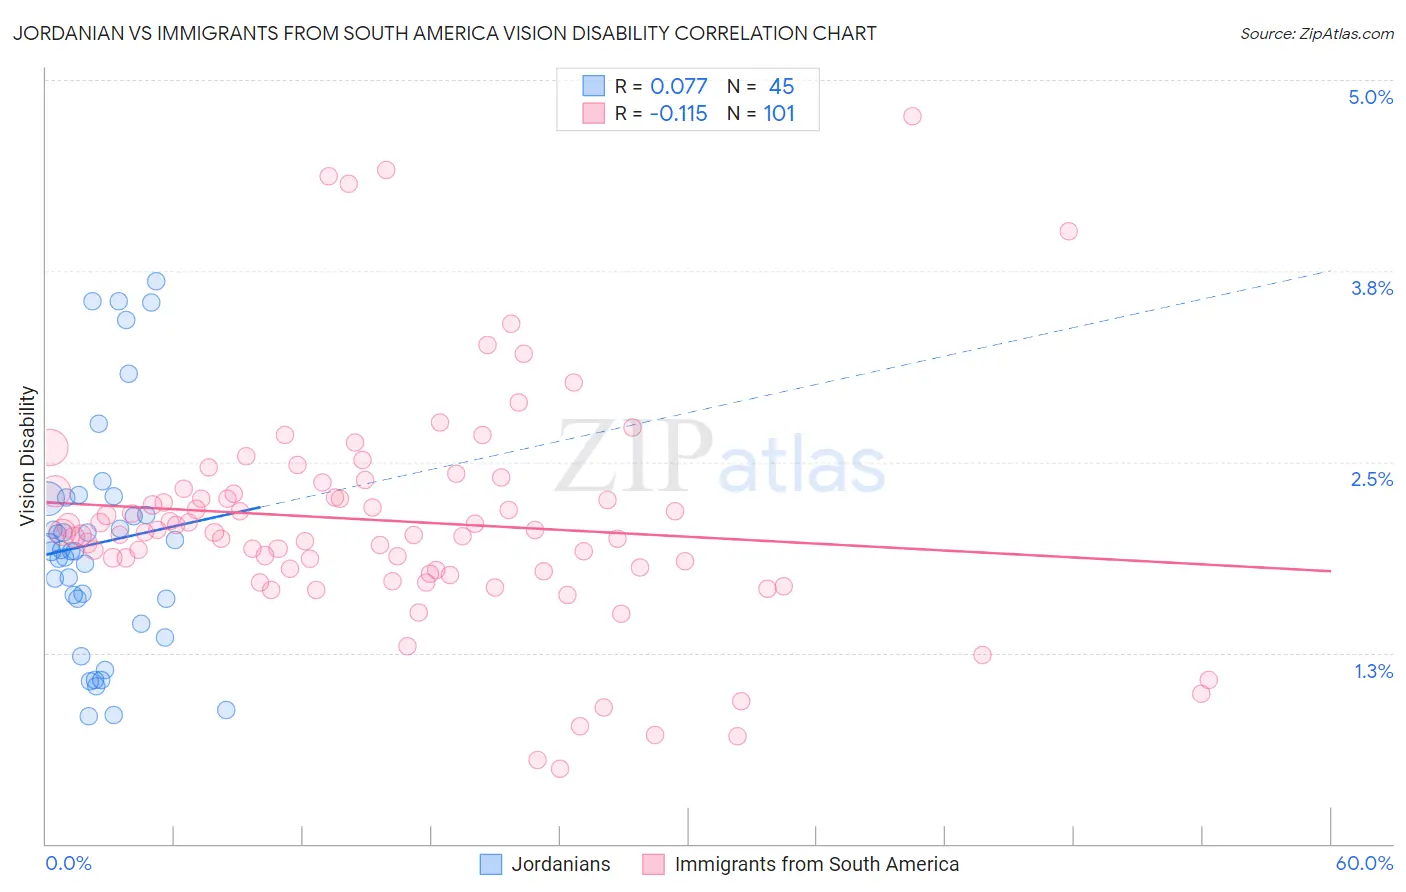
Jordanian vs Immigrants from South America Vision Disability Correlation Chart
The statistical analysis conducted on geographies consisting of 166,387,634 people shows a slight positive correlation between the proportion of Jordanians and percentage of population with vision disability in the United States with a correlation coefficient (R) of 0.077 and weighted average of 2.0%. Similarly, the statistical analysis conducted on geographies consisting of 485,713,263 people shows a poor negative correlation between the proportion of Immigrants from South America and percentage of population with vision disability in the United States with a correlation coefficient (R) of -0.115 and weighted average of 2.1%, a difference of 6.6%.
Vision Disability Correlation Summary
| Measurement | Jordanian | Immigrants from South America |
| Minimum | 0.83% | 0.49% |
| Maximum | 3.7% | 4.8% |
| Range | 2.8% | 4.3% |
| Mean | 2.0% | 2.1% |
| Median | 1.9% | 2.0% |
| Interquartile 25% (IQ1) | 1.5% | 1.8% |
| Interquartile 75% (IQ3) | 2.3% | 2.3% |
| Interquartile Range (IQR) | 0.74% | 0.53% |
| Standard Deviation (Sample) | 0.75% | 0.75% |
| Standard Deviation (Population) | 0.74% | 0.74% |
Similar Demographics by Vision Disability
Demographics Similar to Jordanians by Vision Disability
In terms of vision disability, the demographic groups most similar to Jordanians are Somali (2.0%, a difference of 0.020%), Immigrants from Saudi Arabia (2.0%, a difference of 0.090%), Laotian (2.0%, a difference of 0.17%), Macedonian (2.0%, a difference of 0.22%), and Argentinean (2.0%, a difference of 0.23%).
| Demographics | Rating | Rank | Vision Disability |
| Latvians | 99.5 /100 | #49 | Exceptional 2.0% |
| Afghans | 99.5 /100 | #50 | Exceptional 2.0% |
| Tongans | 99.5 /100 | #51 | Exceptional 2.0% |
| Immigrants | Serbia | 99.4 /100 | #52 | Exceptional 2.0% |
| Immigrants | Belarus | 99.3 /100 | #53 | Exceptional 2.0% |
| Macedonians | 99.3 /100 | #54 | Exceptional 2.0% |
| Laotians | 99.3 /100 | #55 | Exceptional 2.0% |
| Jordanians | 99.2 /100 | #56 | Exceptional 2.0% |
| Somalis | 99.2 /100 | #57 | Exceptional 2.0% |
| Immigrants | Saudi Arabia | 99.2 /100 | #58 | Exceptional 2.0% |
| Argentineans | 99.1 /100 | #59 | Exceptional 2.0% |
| Immigrants | Romania | 99.1 /100 | #60 | Exceptional 2.0% |
| Immigrants | Belgium | 99.1 /100 | #61 | Exceptional 2.0% |
| Immigrants | Russia | 99.1 /100 | #62 | Exceptional 2.0% |
| Armenians | 99.0 /100 | #63 | Exceptional 2.0% |
Demographics Similar to Immigrants from South America by Vision Disability
In terms of vision disability, the demographic groups most similar to Immigrants from South America are Slovene (2.1%, a difference of 0.010%), Immigrants from Southern Europe (2.1%, a difference of 0.070%), Immigrants from Colombia (2.1%, a difference of 0.14%), Immigrants from Norway (2.1%, a difference of 0.15%), and Pakistani (2.1%, a difference of 0.17%).
| Demographics | Rating | Rank | Vision Disability |
| Italians | 79.7 /100 | #146 | Good 2.1% |
| Immigrants | Sudan | 78.4 /100 | #147 | Good 2.1% |
| Finns | 78.3 /100 | #148 | Good 2.1% |
| Colombians | 76.2 /100 | #149 | Good 2.1% |
| Belgians | 75.9 /100 | #150 | Good 2.1% |
| Immigrants | Norway | 75.5 /100 | #151 | Good 2.1% |
| Immigrants | Southern Europe | 74.6 /100 | #152 | Good 2.1% |
| Immigrants | South America | 73.8 /100 | #153 | Good 2.1% |
| Slovenes | 73.6 /100 | #154 | Good 2.1% |
| Immigrants | Colombia | 72.1 /100 | #155 | Good 2.1% |
| Pakistanis | 71.6 /100 | #156 | Good 2.1% |
| Serbians | 70.2 /100 | #157 | Good 2.1% |
| Immigrants | Uzbekistan | 69.9 /100 | #158 | Good 2.1% |
| South Africans | 69.8 /100 | #159 | Good 2.1% |
| Austrians | 69.0 /100 | #160 | Good 2.1% |