Jordanian vs Immigrants from Venezuela College, Under 1 year
COMPARE
Jordanian
Immigrants from Venezuela
College, Under 1 year
College, Under 1 year Comparison
Jordanians
Immigrants from Venezuela
68.0%
COLLEGE, UNDER 1 YEAR
97.4/ 100
METRIC RATING
96th/ 347
METRIC RANK
66.3%
COLLEGE, UNDER 1 YEAR
77.9/ 100
METRIC RATING
149th/ 347
METRIC RANK
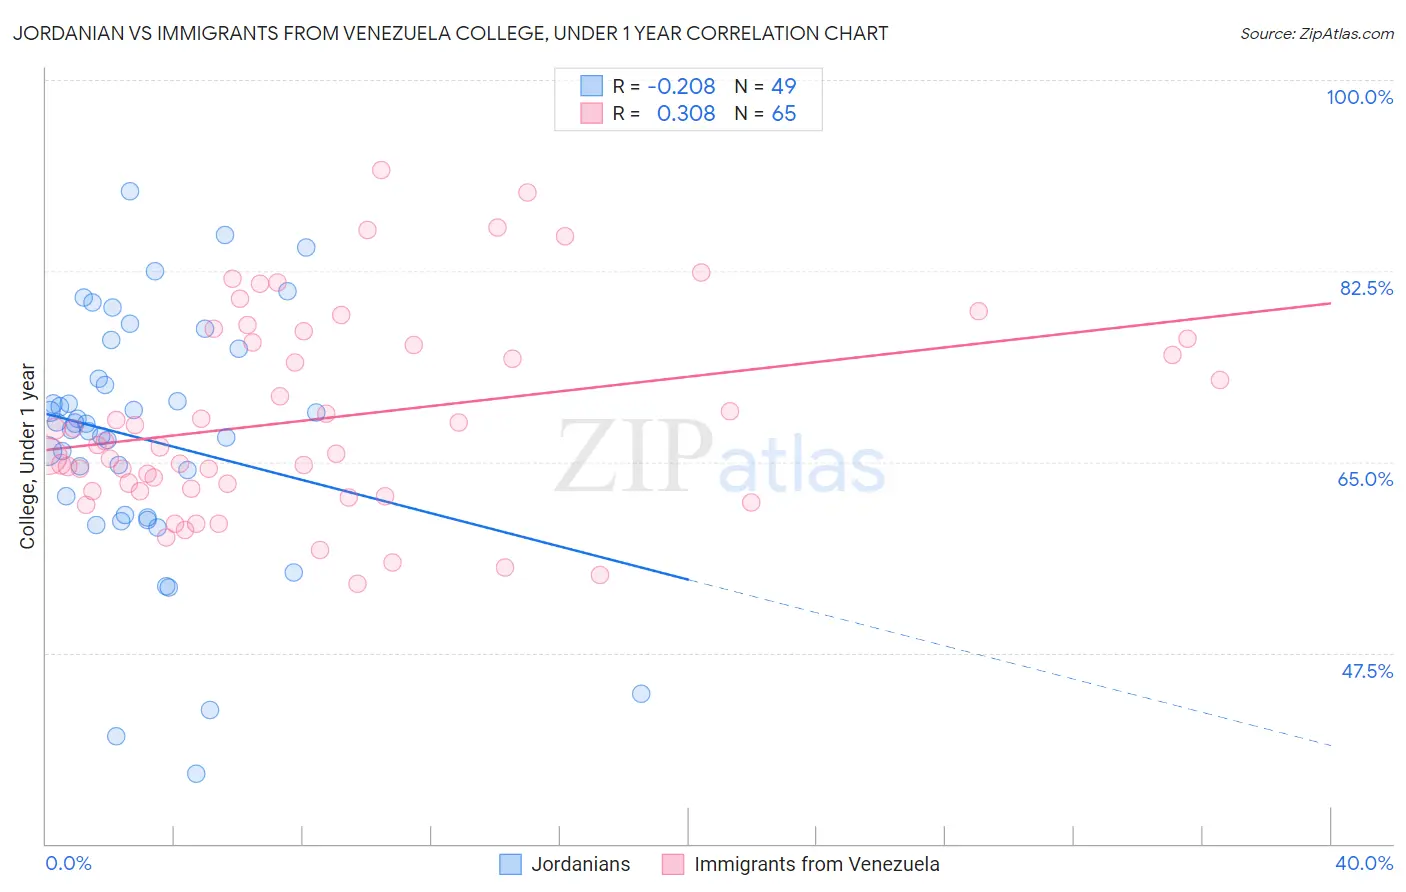
Jordanian vs Immigrants from Venezuela College, Under 1 year Correlation Chart
The statistical analysis conducted on geographies consisting of 166,424,117 people shows a weak negative correlation between the proportion of Jordanians and percentage of population with at least college, under 1 year education in the United States with a correlation coefficient (R) of -0.208 and weighted average of 68.0%. Similarly, the statistical analysis conducted on geographies consisting of 287,866,009 people shows a mild positive correlation between the proportion of Immigrants from Venezuela and percentage of population with at least college, under 1 year education in the United States with a correlation coefficient (R) of 0.308 and weighted average of 66.3%, a difference of 2.6%.
College, Under 1 year Correlation Summary
| Measurement | Jordanian | Immigrants from Venezuela |
| Minimum | 36.4% | 53.8% |
| Maximum | 89.8% | 91.7% |
| Range | 53.4% | 37.9% |
| Mean | 67.0% | 69.0% |
| Median | 68.5% | 66.5% |
| Interquartile 25% (IQ1) | 60.0% | 62.4% |
| Interquartile 75% (IQ3) | 74.0% | 76.1% |
| Interquartile Range (IQR) | 14.0% | 13.7% |
| Standard Deviation (Sample) | 11.5% | 9.2% |
| Standard Deviation (Population) | 11.3% | 9.1% |
Similar Demographics by College, Under 1 year
Demographics Similar to Jordanians by College, Under 1 year
In terms of college, under 1 year, the demographic groups most similar to Jordanians are Immigrants from Pakistan (68.0%, a difference of 0.030%), Immigrants from Ethiopia (68.0%, a difference of 0.030%), Armenian (68.1%, a difference of 0.13%), Paraguayan (67.9%, a difference of 0.13%), and Immigrants from Bolivia (67.9%, a difference of 0.15%).
| Demographics | Rating | Rank | College, Under 1 year |
| Ethiopians | 98.2 /100 | #89 | Exceptional 68.3% |
| Icelanders | 98.1 /100 | #90 | Exceptional 68.3% |
| Europeans | 98.1 /100 | #91 | Exceptional 68.2% |
| Luxembourgers | 98.1 /100 | #92 | Exceptional 68.2% |
| Romanians | 97.9 /100 | #93 | Exceptional 68.2% |
| Armenians | 97.7 /100 | #94 | Exceptional 68.1% |
| Immigrants | Pakistan | 97.5 /100 | #95 | Exceptional 68.0% |
| Jordanians | 97.4 /100 | #96 | Exceptional 68.0% |
| Immigrants | Ethiopia | 97.3 /100 | #97 | Exceptional 68.0% |
| Paraguayans | 97.1 /100 | #98 | Exceptional 67.9% |
| Immigrants | Bolivia | 97.0 /100 | #99 | Exceptional 67.9% |
| Immigrants | Argentina | 97.0 /100 | #100 | Exceptional 67.9% |
| Immigrants | Eastern Europe | 96.9 /100 | #101 | Exceptional 67.9% |
| Palestinians | 96.9 /100 | #102 | Exceptional 67.9% |
| Carpatho Rusyns | 96.8 /100 | #103 | Exceptional 67.9% |
Demographics Similar to Immigrants from Venezuela by College, Under 1 year
In terms of college, under 1 year, the demographic groups most similar to Immigrants from Venezuela are Taiwanese (66.4%, a difference of 0.040%), Immigrants from Iraq (66.3%, a difference of 0.050%), Immigrants from Sudan (66.2%, a difference of 0.12%), Sudanese (66.2%, a difference of 0.23%), and Immigrants from Morocco (66.5%, a difference of 0.25%).
| Demographics | Rating | Rank | College, Under 1 year |
| English | 82.9 /100 | #142 | Excellent 66.6% |
| Immigrants | Uganda | 82.8 /100 | #143 | Excellent 66.5% |
| Immigrants | Germany | 82.0 /100 | #144 | Excellent 66.5% |
| Immigrants | Kenya | 81.8 /100 | #145 | Excellent 66.5% |
| Kenyans | 81.7 /100 | #146 | Excellent 66.5% |
| Immigrants | Morocco | 81.7 /100 | #147 | Excellent 66.5% |
| Taiwanese | 78.6 /100 | #148 | Good 66.4% |
| Immigrants | Venezuela | 77.9 /100 | #149 | Good 66.3% |
| Immigrants | Iraq | 77.1 /100 | #150 | Good 66.3% |
| Immigrants | Sudan | 76.0 /100 | #151 | Good 66.2% |
| Sudanese | 74.1 /100 | #152 | Good 66.2% |
| Belgians | 73.7 /100 | #153 | Good 66.2% |
| Immigrants | Eritrea | 71.9 /100 | #154 | Good 66.1% |
| Irish | 70.3 /100 | #155 | Good 66.0% |
| Welsh | 69.9 /100 | #156 | Good 66.0% |