Jordanian vs British West Indian 5th Grade
COMPARE
Jordanian
British West Indian
5th Grade
5th Grade Comparison
Jordanians
British West Indians
97.5%
5TH GRADE
82.6/ 100
METRIC RATING
145th/ 347
METRIC RANK
96.5%
5TH GRADE
0.0/ 100
METRIC RATING
290th/ 347
METRIC RANK
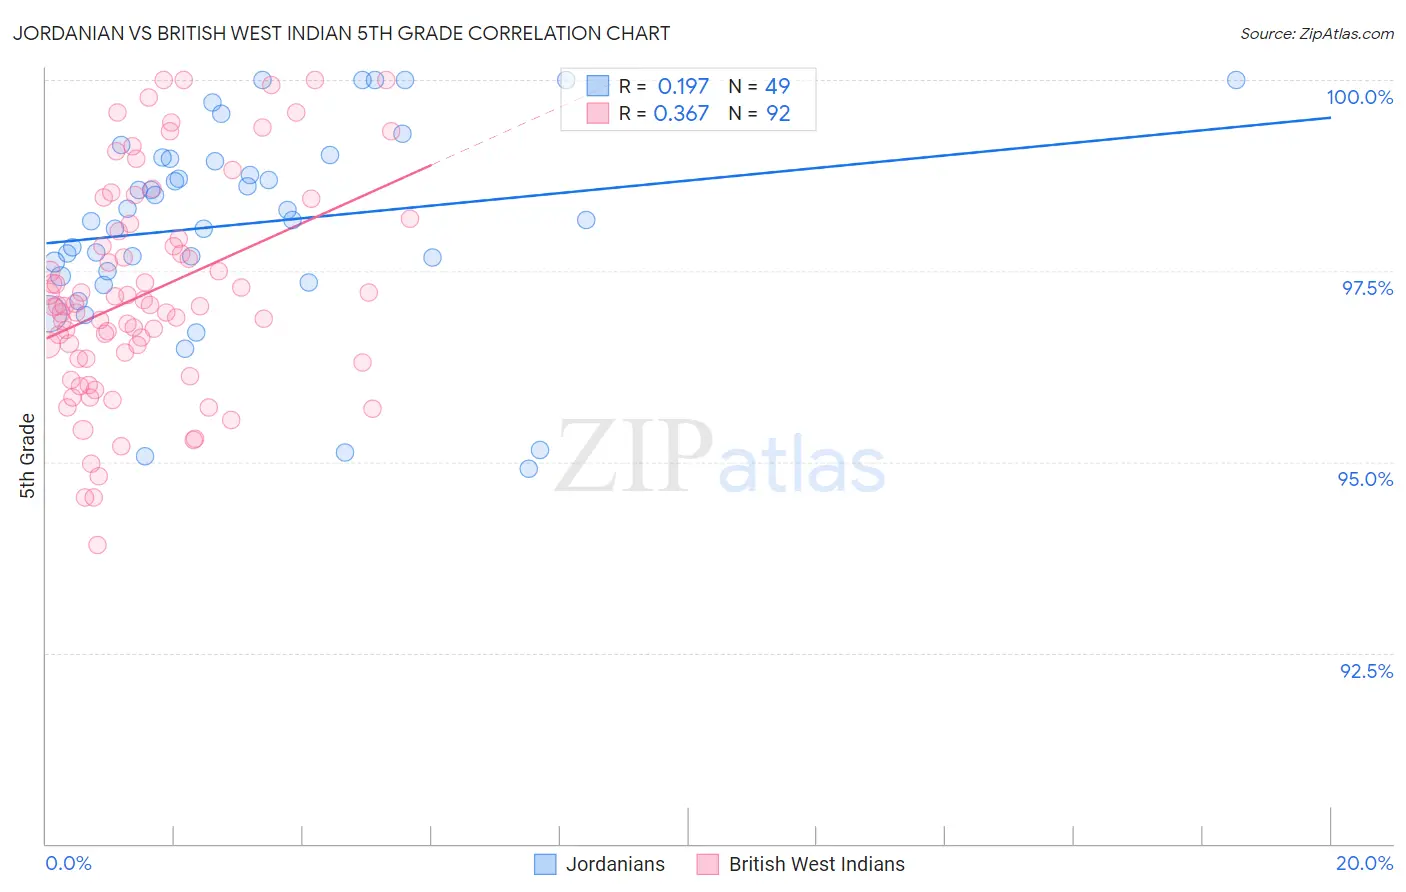
Jordanian vs British West Indian 5th Grade Correlation Chart
The statistical analysis conducted on geographies consisting of 166,424,117 people shows a poor positive correlation between the proportion of Jordanians and percentage of population with at least 5th grade education in the United States with a correlation coefficient (R) of 0.197 and weighted average of 97.5%. Similarly, the statistical analysis conducted on geographies consisting of 152,691,173 people shows a mild positive correlation between the proportion of British West Indians and percentage of population with at least 5th grade education in the United States with a correlation coefficient (R) of 0.367 and weighted average of 96.5%, a difference of 1.1%.
5th Grade Correlation Summary
| Measurement | Jordanian | British West Indian |
| Minimum | 94.9% | 93.9% |
| Maximum | 100.0% | 100.0% |
| Range | 5.1% | 6.1% |
| Mean | 98.1% | 97.2% |
| Median | 98.2% | 97.0% |
| Interquartile 25% (IQ1) | 97.5% | 96.3% |
| Interquartile 75% (IQ3) | 99.0% | 98.1% |
| Interquartile Range (IQR) | 1.5% | 1.7% |
| Standard Deviation (Sample) | 1.3% | 1.4% |
| Standard Deviation (Population) | 1.3% | 1.4% |
Similar Demographics by 5th Grade
Demographics Similar to Jordanians by 5th Grade
In terms of 5th grade, the demographic groups most similar to Jordanians are Immigrants from Greece (97.5%, a difference of 0.0%), Spaniard (97.5%, a difference of 0.0%), Soviet Union (97.5%, a difference of 0.010%), Israeli (97.5%, a difference of 0.020%), and Immigrants from North Macedonia (97.5%, a difference of 0.020%).
| Demographics | Rating | Rank | 5th Grade |
| Blackfeet | 86.8 /100 | #138 | Excellent 97.5% |
| Immigrants | Turkey | 86.7 /100 | #139 | Excellent 97.5% |
| Burmese | 86.1 /100 | #140 | Excellent 97.5% |
| Seminole | 85.8 /100 | #141 | Excellent 97.5% |
| Israelis | 85.5 /100 | #142 | Excellent 97.5% |
| Immigrants | North Macedonia | 85.4 /100 | #143 | Excellent 97.5% |
| Immigrants | Greece | 83.2 /100 | #144 | Excellent 97.5% |
| Jordanians | 82.6 /100 | #145 | Excellent 97.5% |
| Spaniards | 81.9 /100 | #146 | Excellent 97.5% |
| Soviet Union | 81.2 /100 | #147 | Excellent 97.5% |
| Immigrants | Israel | 79.1 /100 | #148 | Good 97.5% |
| Hopi | 78.6 /100 | #149 | Good 97.5% |
| Immigrants | South Central Asia | 78.6 /100 | #150 | Good 97.5% |
| Immigrants | Eastern Europe | 75.0 /100 | #151 | Good 97.4% |
| Ute | 74.9 /100 | #152 | Good 97.4% |
Demographics Similar to British West Indians by 5th Grade
In terms of 5th grade, the demographic groups most similar to British West Indians are Malaysian (96.5%, a difference of 0.0%), Somali (96.5%, a difference of 0.010%), Immigrants from West Indies (96.5%, a difference of 0.020%), Immigrants from Grenada (96.5%, a difference of 0.020%), and Immigrants from Eritrea (96.4%, a difference of 0.060%).
| Demographics | Rating | Rank | 5th Grade |
| Fijians | 0.1 /100 | #283 | Tragic 96.6% |
| Immigrants | Trinidad and Tobago | 0.1 /100 | #284 | Tragic 96.6% |
| Immigrants | St. Vincent and the Grenadines | 0.1 /100 | #285 | Tragic 96.6% |
| Immigrants | Thailand | 0.1 /100 | #286 | Tragic 96.6% |
| Immigrants | Afghanistan | 0.1 /100 | #287 | Tragic 96.6% |
| Immigrants | Barbados | 0.0 /100 | #288 | Tragic 96.6% |
| Immigrants | West Indies | 0.0 /100 | #289 | Tragic 96.5% |
| British West Indians | 0.0 /100 | #290 | Tragic 96.5% |
| Malaysians | 0.0 /100 | #291 | Tragic 96.5% |
| Somalis | 0.0 /100 | #292 | Tragic 96.5% |
| Immigrants | Grenada | 0.0 /100 | #293 | Tragic 96.5% |
| Immigrants | Eritrea | 0.0 /100 | #294 | Tragic 96.4% |
| Immigrants | Somalia | 0.0 /100 | #295 | Tragic 96.4% |
| Immigrants | South Eastern Asia | 0.0 /100 | #296 | Tragic 96.3% |
| Haitians | 0.0 /100 | #297 | Tragic 96.3% |