Japanese vs Immigrants from Bulgaria Vision Disability
COMPARE
Japanese
Immigrants from Bulgaria
Vision Disability
Vision Disability Comparison
Japanese
Immigrants from Bulgaria
2.4%
VISION DISABILITY
0.3/ 100
METRIC RATING
253rd/ 347
METRIC RANK
2.0%
VISION DISABILITY
99.7/ 100
METRIC RATING
47th/ 347
METRIC RANK
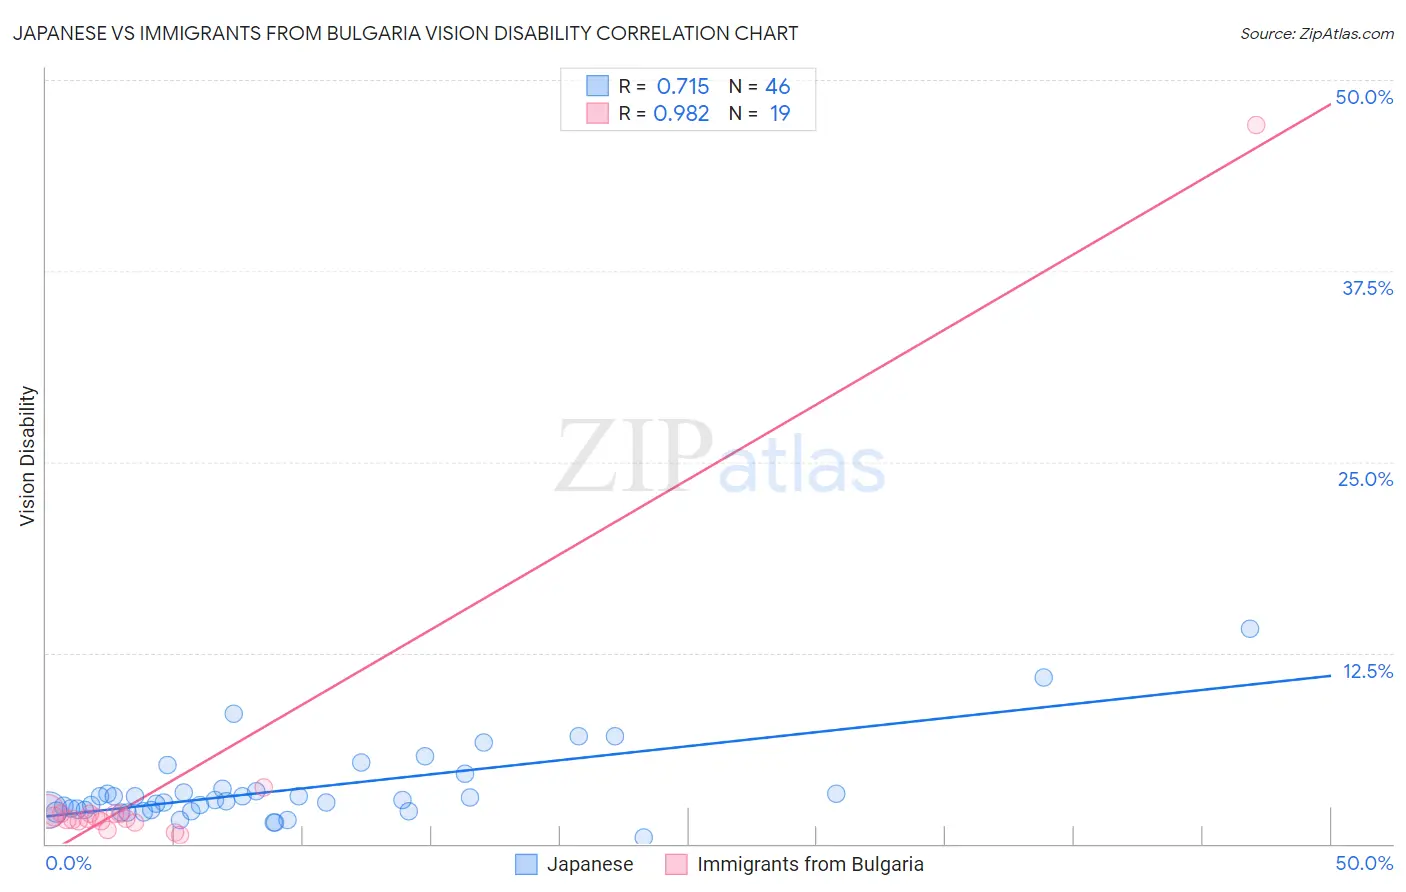
Japanese vs Immigrants from Bulgaria Vision Disability Correlation Chart
The statistical analysis conducted on geographies consisting of 249,077,012 people shows a strong positive correlation between the proportion of Japanese and percentage of population with vision disability in the United States with a correlation coefficient (R) of 0.715 and weighted average of 2.4%. Similarly, the statistical analysis conducted on geographies consisting of 172,526,022 people shows a perfect positive correlation between the proportion of Immigrants from Bulgaria and percentage of population with vision disability in the United States with a correlation coefficient (R) of 0.982 and weighted average of 2.0%, a difference of 19.7%.
Vision Disability Correlation Summary
| Measurement | Japanese | Immigrants from Bulgaria |
| Minimum | 0.43% | 0.56% |
| Maximum | 14.1% | 47.1% |
| Range | 13.7% | 46.5% |
| Mean | 3.6% | 4.1% |
| Median | 2.8% | 1.6% |
| Interquartile 25% (IQ1) | 2.2% | 1.5% |
| Interquartile 75% (IQ3) | 3.4% | 2.0% |
| Interquartile Range (IQR) | 1.2% | 0.48% |
| Standard Deviation (Sample) | 2.6% | 10.4% |
| Standard Deviation (Population) | 2.5% | 10.2% |
Similar Demographics by Vision Disability
Demographics Similar to Japanese by Vision Disability
In terms of vision disability, the demographic groups most similar to Japanese are Immigrants from Micronesia (2.4%, a difference of 0.070%), Haitian (2.4%, a difference of 0.28%), Immigrants from Guatemala (2.4%, a difference of 0.31%), Immigrants from Laos (2.4%, a difference of 0.39%), and Bangladeshi (2.3%, a difference of 0.50%).
| Demographics | Rating | Rank | Vision Disability |
| French | 0.5 /100 | #246 | Tragic 2.3% |
| Guatemalans | 0.5 /100 | #247 | Tragic 2.3% |
| Sub-Saharan Africans | 0.5 /100 | #248 | Tragic 2.3% |
| Liberians | 0.5 /100 | #249 | Tragic 2.3% |
| Bangladeshis | 0.5 /100 | #250 | Tragic 2.3% |
| Immigrants | Laos | 0.4 /100 | #251 | Tragic 2.4% |
| Immigrants | Micronesia | 0.3 /100 | #252 | Tragic 2.4% |
| Japanese | 0.3 /100 | #253 | Tragic 2.4% |
| Haitians | 0.3 /100 | #254 | Tragic 2.4% |
| Immigrants | Guatemala | 0.3 /100 | #255 | Tragic 2.4% |
| Immigrants | Haiti | 0.2 /100 | #256 | Tragic 2.4% |
| West Indians | 0.2 /100 | #257 | Tragic 2.4% |
| British West Indians | 0.2 /100 | #258 | Tragic 2.4% |
| Whites/Caucasians | 0.2 /100 | #259 | Tragic 2.4% |
| Belizeans | 0.2 /100 | #260 | Tragic 2.4% |
Demographics Similar to Immigrants from Bulgaria by Vision Disability
In terms of vision disability, the demographic groups most similar to Immigrants from Bulgaria are Immigrants from Sweden (2.0%, a difference of 0.020%), Ethiopian (2.0%, a difference of 0.060%), Immigrants from Indonesia (2.0%, a difference of 0.090%), Eastern European (2.0%, a difference of 0.11%), and Immigrants from Ethiopia (2.0%, a difference of 0.17%).
| Demographics | Rating | Rank | Vision Disability |
| Immigrants | Ireland | 99.7 /100 | #40 | Exceptional 2.0% |
| Cypriots | 99.7 /100 | #41 | Exceptional 2.0% |
| Immigrants | Ethiopia | 99.7 /100 | #42 | Exceptional 2.0% |
| Eastern Europeans | 99.7 /100 | #43 | Exceptional 2.0% |
| Immigrants | Indonesia | 99.7 /100 | #44 | Exceptional 2.0% |
| Ethiopians | 99.7 /100 | #45 | Exceptional 2.0% |
| Immigrants | Sweden | 99.7 /100 | #46 | Exceptional 2.0% |
| Immigrants | Bulgaria | 99.7 /100 | #47 | Exceptional 2.0% |
| Israelis | 99.6 /100 | #48 | Exceptional 2.0% |
| Latvians | 99.5 /100 | #49 | Exceptional 2.0% |
| Afghans | 99.5 /100 | #50 | Exceptional 2.0% |
| Tongans | 99.5 /100 | #51 | Exceptional 2.0% |
| Immigrants | Serbia | 99.4 /100 | #52 | Exceptional 2.0% |
| Immigrants | Belarus | 99.3 /100 | #53 | Exceptional 2.0% |
| Macedonians | 99.3 /100 | #54 | Exceptional 2.0% |