Jamaican vs Nonimmigrants Disability Age Over 75
COMPARE
Jamaican
Nonimmigrants
Disability Age Over 75
Disability Age Over 75 Comparison
Jamaicans
Nonimmigrants
47.7%
DISABILITY AGE OVER 75
19.0/ 100
METRIC RATING
206th/ 347
METRIC RANK
48.0%
DISABILITY AGE OVER 75
6.5/ 100
METRIC RATING
226th/ 347
METRIC RANK
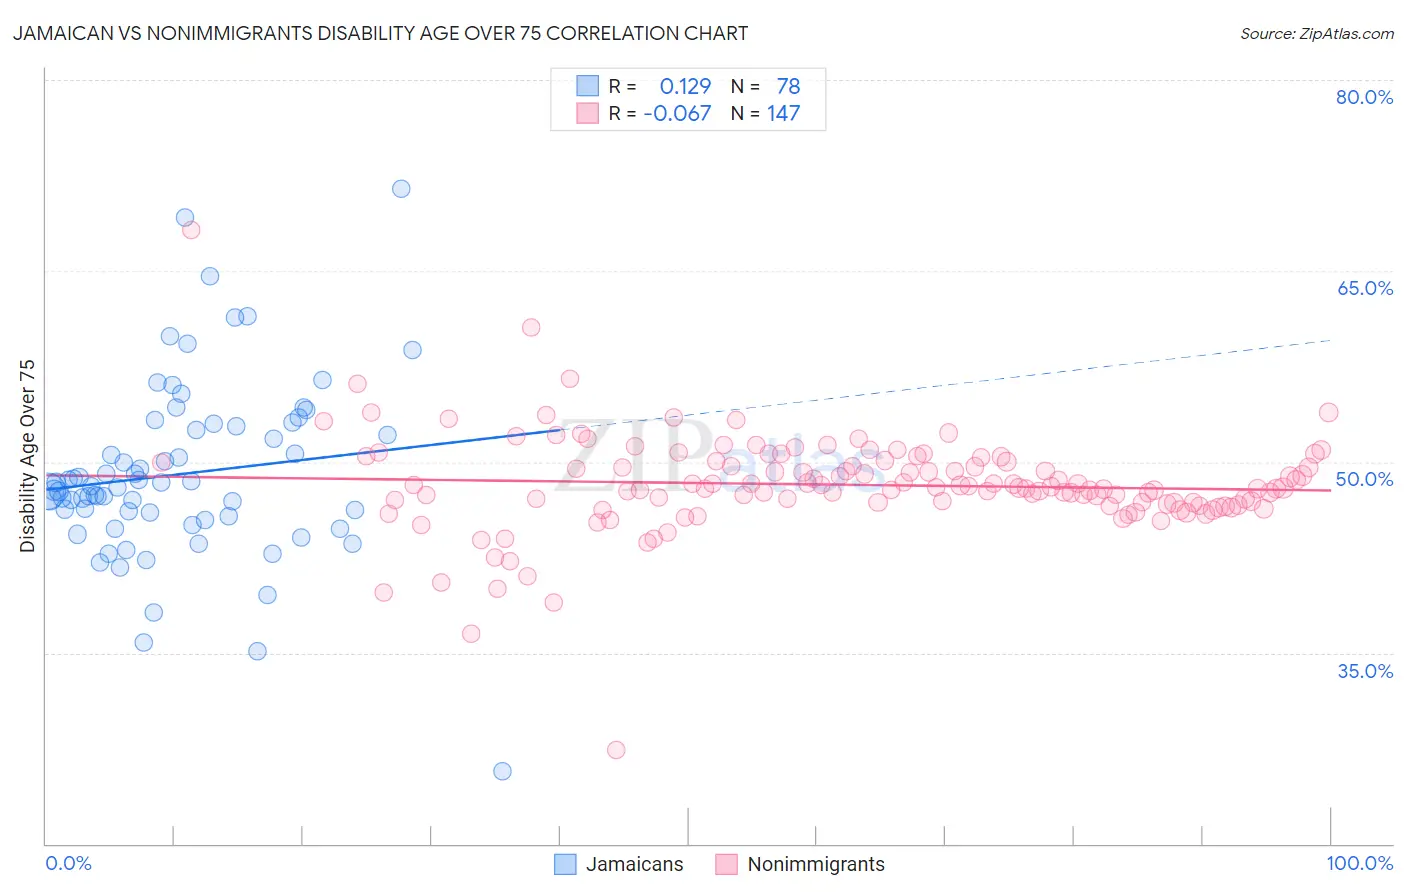
Jamaican vs Nonimmigrants Disability Age Over 75 Correlation Chart
The statistical analysis conducted on geographies consisting of 366,963,614 people shows a poor positive correlation between the proportion of Jamaicans and percentage of population with a disability over the age of 75 in the United States with a correlation coefficient (R) of 0.129 and weighted average of 47.7%. Similarly, the statistical analysis conducted on geographies consisting of 582,018,698 people shows a slight negative correlation between the proportion of Nonimmigrants and percentage of population with a disability over the age of 75 in the United States with a correlation coefficient (R) of -0.067 and weighted average of 48.0%, a difference of 0.68%.
Disability Age Over 75 Correlation Summary
| Measurement | Jamaican | Nonimmigrants |
| Minimum | 25.7% | 27.4% |
| Maximum | 71.4% | 68.2% |
| Range | 45.7% | 40.9% |
| Mean | 49.0% | 48.2% |
| Median | 48.1% | 47.9% |
| Interquartile 25% (IQ1) | 45.7% | 46.7% |
| Interquartile 75% (IQ3) | 52.8% | 50.0% |
| Interquartile Range (IQR) | 7.1% | 3.3% |
| Standard Deviation (Sample) | 7.0% | 4.0% |
| Standard Deviation (Population) | 7.0% | 4.0% |
Demographics Similar to Jamaicans and Nonimmigrants by Disability Age Over 75
In terms of disability age over 75, the demographic groups most similar to Jamaicans are Immigrants from Syria (47.8%, a difference of 0.060%), Immigrants from Senegal (47.8%, a difference of 0.080%), Immigrants from Indonesia (47.8%, a difference of 0.20%), Vietnamese (47.9%, a difference of 0.31%), and Panamanian (47.9%, a difference of 0.31%). Similarly, the demographic groups most similar to Nonimmigrants are Spanish (48.0%, a difference of 0.010%), Liberian (48.0%, a difference of 0.020%), Barbadian (48.0%, a difference of 0.030%), Immigrants from Bangladesh (48.0%, a difference of 0.030%), and Immigrants from Oceania (48.0%, a difference of 0.070%).
| Demographics | Rating | Rank | Disability Age Over 75 |
| Jamaicans | 19.0 /100 | #206 | Poor 47.7% |
| Immigrants | Syria | 17.4 /100 | #207 | Poor 47.8% |
| Immigrants | Senegal | 16.9 /100 | #208 | Poor 47.8% |
| Immigrants | Indonesia | 14.2 /100 | #209 | Poor 47.8% |
| Vietnamese | 11.9 /100 | #210 | Poor 47.9% |
| Panamanians | 11.8 /100 | #211 | Poor 47.9% |
| Immigrants | Burma/Myanmar | 11.7 /100 | #212 | Poor 47.9% |
| Laotians | 11.5 /100 | #213 | Poor 47.9% |
| Immigrants | Barbados | 10.7 /100 | #214 | Poor 47.9% |
| Senegalese | 10.7 /100 | #215 | Poor 47.9% |
| Immigrants | Panama | 10.2 /100 | #216 | Poor 47.9% |
| Immigrants | Grenada | 9.4 /100 | #217 | Tragic 47.9% |
| Immigrants | Western Africa | 8.3 /100 | #218 | Tragic 48.0% |
| Immigrants | Western Asia | 7.5 /100 | #219 | Tragic 48.0% |
| Bahamians | 7.4 /100 | #220 | Tragic 48.0% |
| Immigrants | Oceania | 7.3 /100 | #221 | Tragic 48.0% |
| Barbadians | 6.8 /100 | #222 | Tragic 48.0% |
| Immigrants | Bangladesh | 6.8 /100 | #223 | Tragic 48.0% |
| Liberians | 6.7 /100 | #224 | Tragic 48.0% |
| Spanish | 6.5 /100 | #225 | Tragic 48.0% |
| Immigrants | Nonimmigrants | 6.5 /100 | #226 | Tragic 48.0% |