Jamaican vs Immigrants from Indonesia Disability Age Over 75
COMPARE
Jamaican
Immigrants from Indonesia
Disability Age Over 75
Disability Age Over 75 Comparison
Jamaicans
Immigrants from Indonesia
47.7%
DISABILITY AGE OVER 75
19.0/ 100
METRIC RATING
206th/ 347
METRIC RANK
47.8%
DISABILITY AGE OVER 75
14.2/ 100
METRIC RATING
209th/ 347
METRIC RANK
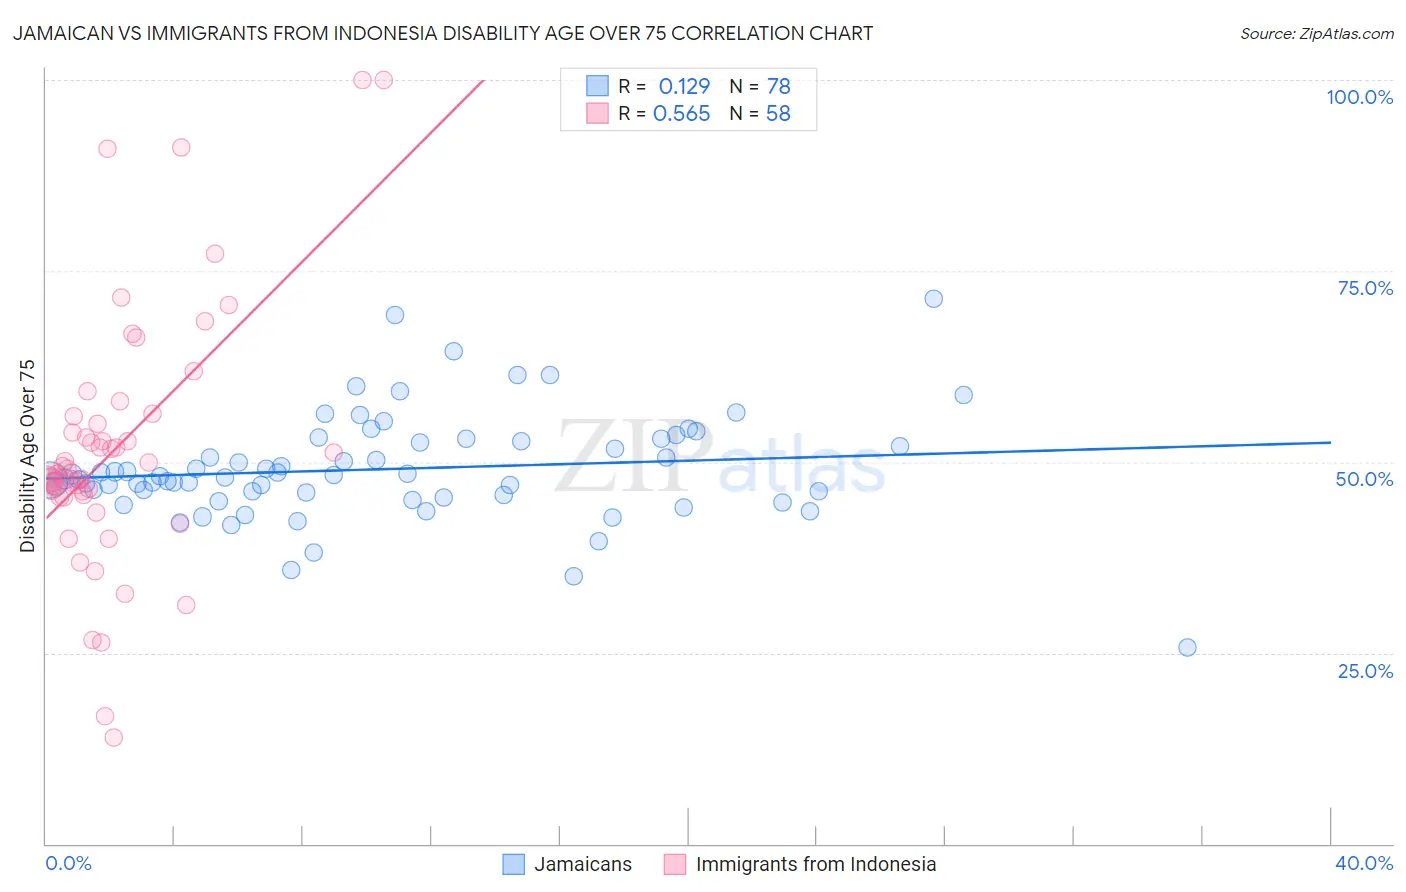
Jamaican vs Immigrants from Indonesia Disability Age Over 75 Correlation Chart
The statistical analysis conducted on geographies consisting of 366,963,614 people shows a poor positive correlation between the proportion of Jamaicans and percentage of population with a disability over the age of 75 in the United States with a correlation coefficient (R) of 0.129 and weighted average of 47.7%. Similarly, the statistical analysis conducted on geographies consisting of 215,623,970 people shows a substantial positive correlation between the proportion of Immigrants from Indonesia and percentage of population with a disability over the age of 75 in the United States with a correlation coefficient (R) of 0.565 and weighted average of 47.8%, a difference of 0.20%.
Disability Age Over 75 Correlation Summary
| Measurement | Jamaican | Immigrants from Indonesia |
| Minimum | 25.7% | 13.9% |
| Maximum | 71.4% | 100.0% |
| Range | 45.7% | 86.1% |
| Mean | 49.0% | 51.8% |
| Median | 48.1% | 48.8% |
| Interquartile 25% (IQ1) | 45.7% | 45.7% |
| Interquartile 75% (IQ3) | 52.8% | 56.0% |
| Interquartile Range (IQR) | 7.1% | 10.3% |
| Standard Deviation (Sample) | 7.0% | 16.9% |
| Standard Deviation (Population) | 7.0% | 16.7% |
Demographics Similar to Jamaicans and Immigrants from Indonesia by Disability Age Over 75
In terms of disability age over 75, the demographic groups most similar to Jamaicans are Immigrants from Ghana (47.7%, a difference of 0.0%), Nigerian (47.7%, a difference of 0.010%), Trinidadian and Tobagonian (47.7%, a difference of 0.040%), Immigrants from Cuba (47.7%, a difference of 0.060%), and Immigrants from Bahamas (47.7%, a difference of 0.060%). Similarly, the demographic groups most similar to Immigrants from Indonesia are Immigrants from Senegal (47.8%, a difference of 0.11%), Vietnamese (47.9%, a difference of 0.11%), Panamanian (47.9%, a difference of 0.12%), Immigrants from Burma/Myanmar (47.9%, a difference of 0.12%), and Immigrants from Syria (47.8%, a difference of 0.13%).
| Demographics | Rating | Rank | Disability Age Over 75 |
| Pakistanis | 23.4 /100 | #197 | Fair 47.7% |
| Immigrants | Ukraine | 23.2 /100 | #198 | Fair 47.7% |
| Immigrants | Eritrea | 22.4 /100 | #199 | Fair 47.7% |
| Immigrants | Somalia | 21.4 /100 | #200 | Fair 47.7% |
| Immigrants | Cuba | 20.9 /100 | #201 | Fair 47.7% |
| Immigrants | Bahamas | 20.7 /100 | #202 | Fair 47.7% |
| Trinidadians and Tobagonians | 20.0 /100 | #203 | Fair 47.7% |
| Nigerians | 19.2 /100 | #204 | Poor 47.7% |
| Immigrants | Ghana | 19.1 /100 | #205 | Poor 47.7% |
| Jamaicans | 19.0 /100 | #206 | Poor 47.7% |
| Immigrants | Syria | 17.4 /100 | #207 | Poor 47.8% |
| Immigrants | Senegal | 16.9 /100 | #208 | Poor 47.8% |
| Immigrants | Indonesia | 14.2 /100 | #209 | Poor 47.8% |
| Vietnamese | 11.9 /100 | #210 | Poor 47.9% |
| Panamanians | 11.8 /100 | #211 | Poor 47.9% |
| Immigrants | Burma/Myanmar | 11.7 /100 | #212 | Poor 47.9% |
| Laotians | 11.5 /100 | #213 | Poor 47.9% |
| Immigrants | Barbados | 10.7 /100 | #214 | Poor 47.9% |
| Senegalese | 10.7 /100 | #215 | Poor 47.9% |
| Immigrants | Panama | 10.2 /100 | #216 | Poor 47.9% |
| Immigrants | Grenada | 9.4 /100 | #217 | Tragic 47.9% |