Jamaican vs Immigrants from Peru Cognitive Disability
COMPARE
Jamaican
Immigrants from Peru
Cognitive Disability
Cognitive Disability Comparison
Jamaicans
Immigrants from Peru
17.9%
COGNITIVE DISABILITY
0.9/ 100
METRIC RATING
244th/ 347
METRIC RANK
16.6%
COGNITIVE DISABILITY
99.7/ 100
METRIC RATING
59th/ 347
METRIC RANK
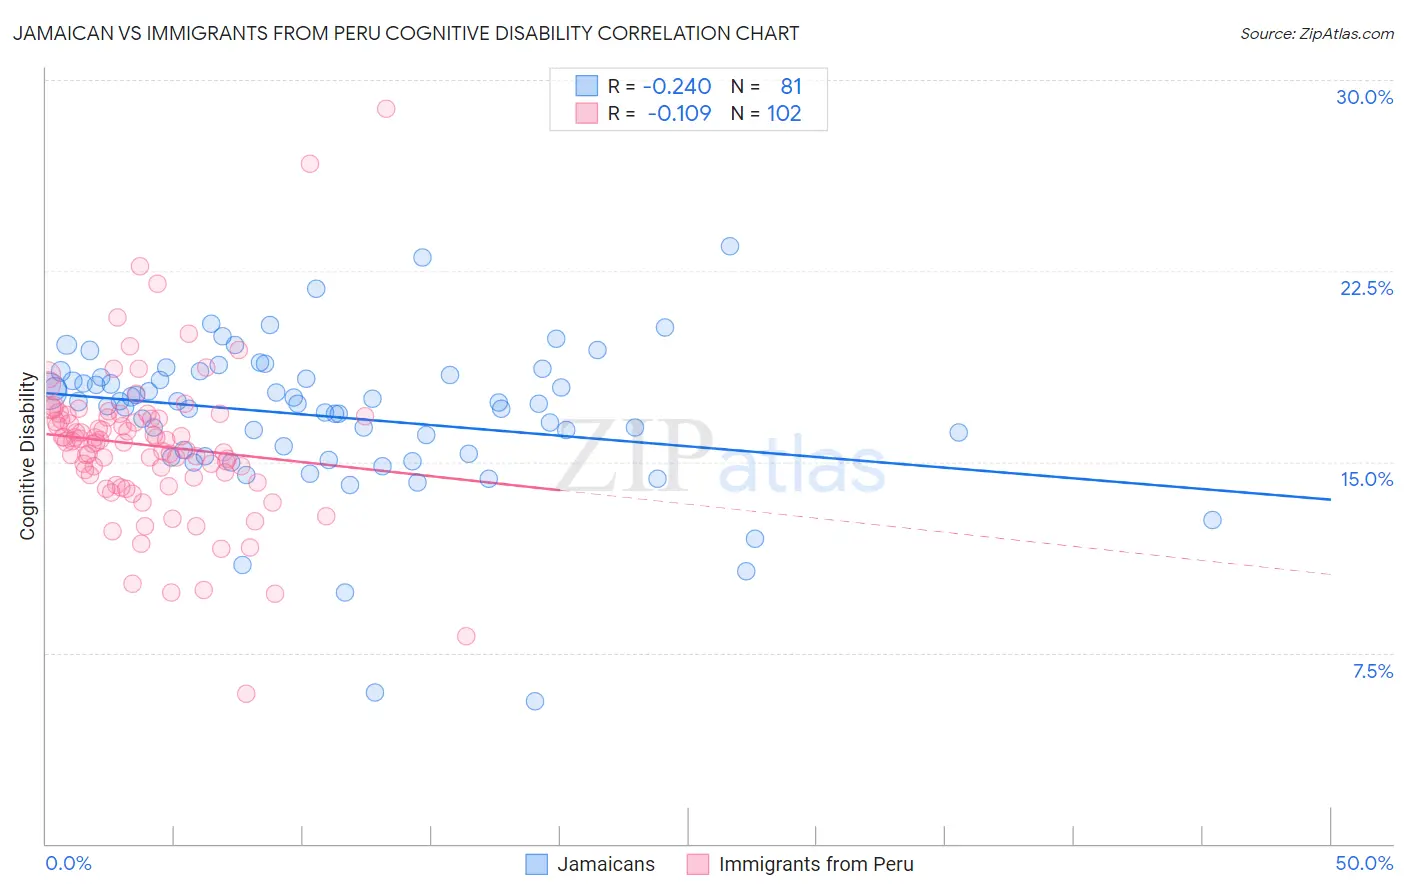
Jamaican vs Immigrants from Peru Cognitive Disability Correlation Chart
The statistical analysis conducted on geographies consisting of 367,984,086 people shows a weak negative correlation between the proportion of Jamaicans and percentage of population with cognitive disability in the United States with a correlation coefficient (R) of -0.240 and weighted average of 17.9%. Similarly, the statistical analysis conducted on geographies consisting of 328,830,474 people shows a poor negative correlation between the proportion of Immigrants from Peru and percentage of population with cognitive disability in the United States with a correlation coefficient (R) of -0.109 and weighted average of 16.6%, a difference of 7.7%.
Cognitive Disability Correlation Summary
| Measurement | Jamaican | Immigrants from Peru |
| Minimum | 5.6% | 5.9% |
| Maximum | 23.5% | 28.9% |
| Range | 17.9% | 23.0% |
| Mean | 16.8% | 15.7% |
| Median | 17.3% | 15.8% |
| Interquartile 25% (IQ1) | 15.3% | 14.4% |
| Interquartile 75% (IQ3) | 18.4% | 16.8% |
| Interquartile Range (IQR) | 3.1% | 2.4% |
| Standard Deviation (Sample) | 3.0% | 3.1% |
| Standard Deviation (Population) | 3.0% | 3.1% |
Similar Demographics by Cognitive Disability
Demographics Similar to Jamaicans by Cognitive Disability
In terms of cognitive disability, the demographic groups most similar to Jamaicans are Immigrants from Bangladesh (17.8%, a difference of 0.040%), Trinidadian and Tobagonian (17.9%, a difference of 0.090%), Paiute (17.8%, a difference of 0.11%), Immigrants from Thailand (17.9%, a difference of 0.12%), and Mexican (17.8%, a difference of 0.13%).
| Demographics | Rating | Rank | Cognitive Disability |
| Immigrants | Mexico | 1.8 /100 | #237 | Tragic 17.8% |
| Cheyenne | 1.7 /100 | #238 | Tragic 17.8% |
| Cajuns | 1.4 /100 | #239 | Tragic 17.8% |
| Iraqis | 1.4 /100 | #240 | Tragic 17.8% |
| Mexicans | 1.1 /100 | #241 | Tragic 17.8% |
| Paiute | 1.1 /100 | #242 | Tragic 17.8% |
| Immigrants | Bangladesh | 1.0 /100 | #243 | Tragic 17.8% |
| Jamaicans | 0.9 /100 | #244 | Tragic 17.9% |
| Trinidadians and Tobagonians | 0.8 /100 | #245 | Tragic 17.9% |
| Immigrants | Thailand | 0.8 /100 | #246 | Tragic 17.9% |
| Samoans | 0.7 /100 | #247 | Tragic 17.9% |
| French American Indians | 0.7 /100 | #248 | Tragic 17.9% |
| Cree | 0.7 /100 | #249 | Tragic 17.9% |
| Immigrants | Ethiopia | 0.7 /100 | #250 | Tragic 17.9% |
| Malaysians | 0.6 /100 | #251 | Tragic 17.9% |
Demographics Similar to Immigrants from Peru by Cognitive Disability
In terms of cognitive disability, the demographic groups most similar to Immigrants from Peru are Pennsylvania German (16.6%, a difference of 0.0%), Romanian (16.6%, a difference of 0.010%), Immigrants from England (16.6%, a difference of 0.070%), Austrian (16.6%, a difference of 0.080%), and Bhutanese (16.6%, a difference of 0.080%).
| Demographics | Rating | Rank | Cognitive Disability |
| Soviet Union | 99.8 /100 | #52 | Exceptional 16.5% |
| Swedes | 99.8 /100 | #53 | Exceptional 16.5% |
| Immigrants | Iran | 99.8 /100 | #54 | Exceptional 16.5% |
| Immigrants | Venezuela | 99.7 /100 | #55 | Exceptional 16.5% |
| Austrians | 99.7 /100 | #56 | Exceptional 16.6% |
| Bhutanese | 99.7 /100 | #57 | Exceptional 16.6% |
| Pennsylvania Germans | 99.7 /100 | #58 | Exceptional 16.6% |
| Immigrants | Peru | 99.7 /100 | #59 | Exceptional 16.6% |
| Romanians | 99.7 /100 | #60 | Exceptional 16.6% |
| Immigrants | England | 99.6 /100 | #61 | Exceptional 16.6% |
| Czechoslovakians | 99.6 /100 | #62 | Exceptional 16.6% |
| Argentineans | 99.6 /100 | #63 | Exceptional 16.6% |
| Venezuelans | 99.6 /100 | #64 | Exceptional 16.6% |
| Colombians | 99.6 /100 | #65 | Exceptional 16.6% |
| Immigrants | Ukraine | 99.5 /100 | #66 | Exceptional 16.6% |