Jamaican vs Immigrants from Russia Cognitive Disability
COMPARE
Jamaican
Immigrants from Russia
Cognitive Disability
Cognitive Disability Comparison
Jamaicans
Immigrants from Russia
17.9%
COGNITIVE DISABILITY
0.9/ 100
METRIC RATING
244th/ 347
METRIC RANK
16.8%
COGNITIVE DISABILITY
98.2/ 100
METRIC RATING
100th/ 347
METRIC RANK
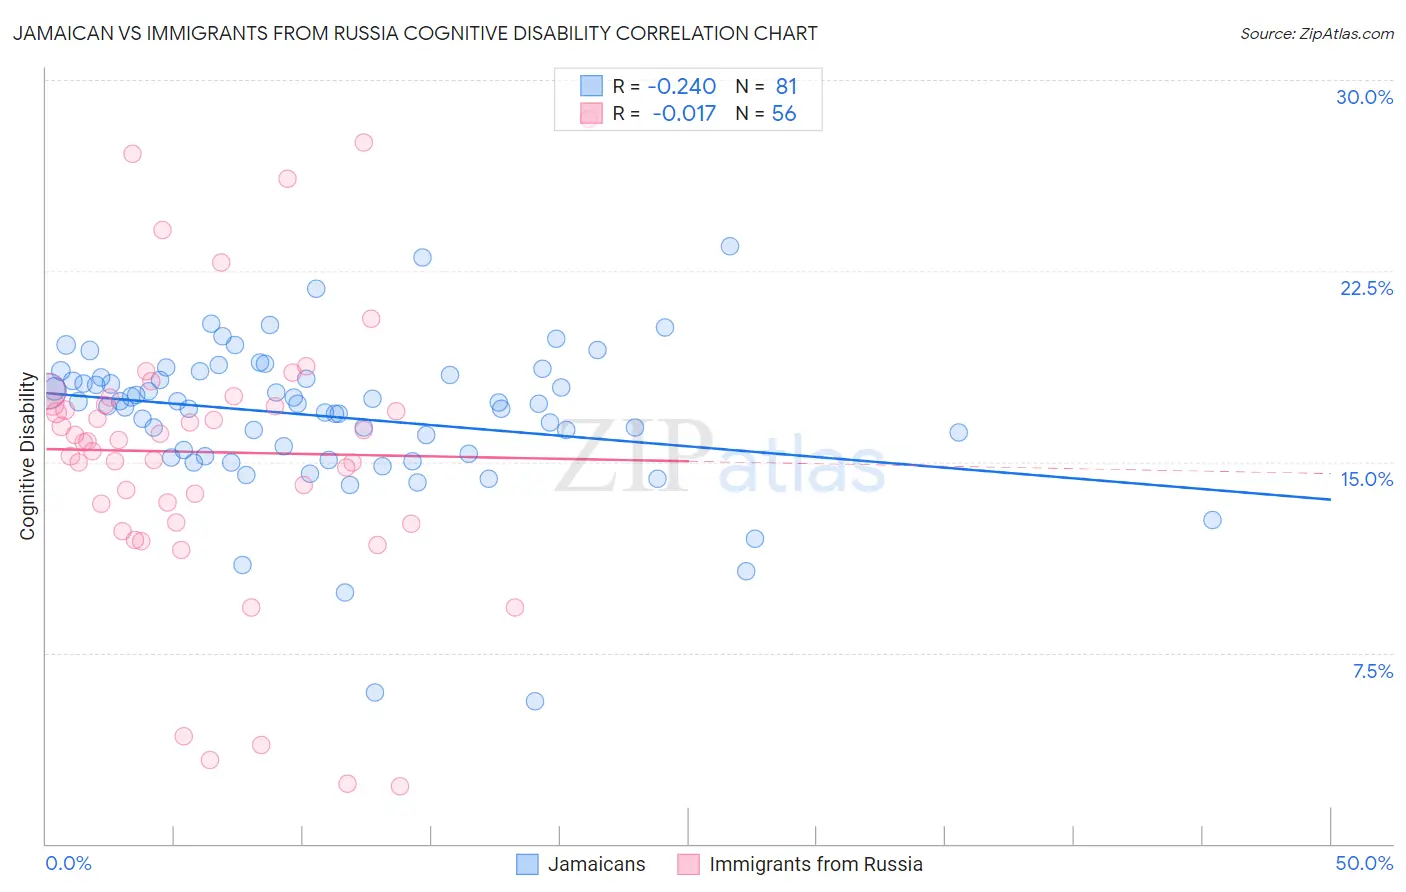
Jamaican vs Immigrants from Russia Cognitive Disability Correlation Chart
The statistical analysis conducted on geographies consisting of 367,984,086 people shows a weak negative correlation between the proportion of Jamaicans and percentage of population with cognitive disability in the United States with a correlation coefficient (R) of -0.240 and weighted average of 17.9%. Similarly, the statistical analysis conducted on geographies consisting of 347,925,749 people shows no correlation between the proportion of Immigrants from Russia and percentage of population with cognitive disability in the United States with a correlation coefficient (R) of -0.017 and weighted average of 16.8%, a difference of 6.3%.
Cognitive Disability Correlation Summary
| Measurement | Jamaican | Immigrants from Russia |
| Minimum | 5.6% | 2.3% |
| Maximum | 23.5% | 28.5% |
| Range | 17.9% | 26.2% |
| Mean | 16.8% | 15.4% |
| Median | 17.3% | 15.8% |
| Interquartile 25% (IQ1) | 15.3% | 13.0% |
| Interquartile 75% (IQ3) | 18.4% | 17.4% |
| Interquartile Range (IQR) | 3.1% | 4.4% |
| Standard Deviation (Sample) | 3.0% | 5.6% |
| Standard Deviation (Population) | 3.0% | 5.6% |
Similar Demographics by Cognitive Disability
Demographics Similar to Jamaicans by Cognitive Disability
In terms of cognitive disability, the demographic groups most similar to Jamaicans are Immigrants from Bangladesh (17.8%, a difference of 0.040%), Trinidadian and Tobagonian (17.9%, a difference of 0.090%), Paiute (17.8%, a difference of 0.11%), Immigrants from Thailand (17.9%, a difference of 0.12%), and Mexican (17.8%, a difference of 0.13%).
| Demographics | Rating | Rank | Cognitive Disability |
| Immigrants | Mexico | 1.8 /100 | #237 | Tragic 17.8% |
| Cheyenne | 1.7 /100 | #238 | Tragic 17.8% |
| Cajuns | 1.4 /100 | #239 | Tragic 17.8% |
| Iraqis | 1.4 /100 | #240 | Tragic 17.8% |
| Mexicans | 1.1 /100 | #241 | Tragic 17.8% |
| Paiute | 1.1 /100 | #242 | Tragic 17.8% |
| Immigrants | Bangladesh | 1.0 /100 | #243 | Tragic 17.8% |
| Jamaicans | 0.9 /100 | #244 | Tragic 17.9% |
| Trinidadians and Tobagonians | 0.8 /100 | #245 | Tragic 17.9% |
| Immigrants | Thailand | 0.8 /100 | #246 | Tragic 17.9% |
| Samoans | 0.7 /100 | #247 | Tragic 17.9% |
| French American Indians | 0.7 /100 | #248 | Tragic 17.9% |
| Cree | 0.7 /100 | #249 | Tragic 17.9% |
| Immigrants | Ethiopia | 0.7 /100 | #250 | Tragic 17.9% |
| Malaysians | 0.6 /100 | #251 | Tragic 17.9% |
Demographics Similar to Immigrants from Russia by Cognitive Disability
In terms of cognitive disability, the demographic groups most similar to Immigrants from Russia are Immigrants from Asia (16.8%, a difference of 0.0%), Jordanian (16.8%, a difference of 0.030%), Irish (16.8%, a difference of 0.030%), Paraguayan (16.8%, a difference of 0.080%), and Palestinian (16.8%, a difference of 0.080%).
| Demographics | Rating | Rank | Cognitive Disability |
| Immigrants | Southern Europe | 98.7 /100 | #93 | Exceptional 16.7% |
| Asians | 98.7 /100 | #94 | Exceptional 16.7% |
| English | 98.6 /100 | #95 | Exceptional 16.8% |
| Finns | 98.5 /100 | #96 | Exceptional 16.8% |
| Dutch | 98.5 /100 | #97 | Exceptional 16.8% |
| Immigrants | Lebanon | 98.4 /100 | #98 | Exceptional 16.8% |
| Jordanians | 98.2 /100 | #99 | Exceptional 16.8% |
| Immigrants | Russia | 98.2 /100 | #100 | Exceptional 16.8% |
| Immigrants | Asia | 98.1 /100 | #101 | Exceptional 16.8% |
| Irish | 98.1 /100 | #102 | Exceptional 16.8% |
| Paraguayans | 98.0 /100 | #103 | Exceptional 16.8% |
| Palestinians | 98.0 /100 | #104 | Exceptional 16.8% |
| Immigrants | Eastern Asia | 97.9 /100 | #105 | Exceptional 16.8% |
| Northern Europeans | 97.8 /100 | #106 | Exceptional 16.8% |
| Immigrants | Nicaragua | 97.8 /100 | #107 | Exceptional 16.8% |