Jamaican vs Immigrants from Spain Cognitive Disability
COMPARE
Jamaican
Immigrants from Spain
Cognitive Disability
Cognitive Disability Comparison
Jamaicans
Immigrants from Spain
17.9%
COGNITIVE DISABILITY
0.9/ 100
METRIC RATING
244th/ 347
METRIC RANK
17.4%
COGNITIVE DISABILITY
27.7/ 100
METRIC RATING
190th/ 347
METRIC RANK
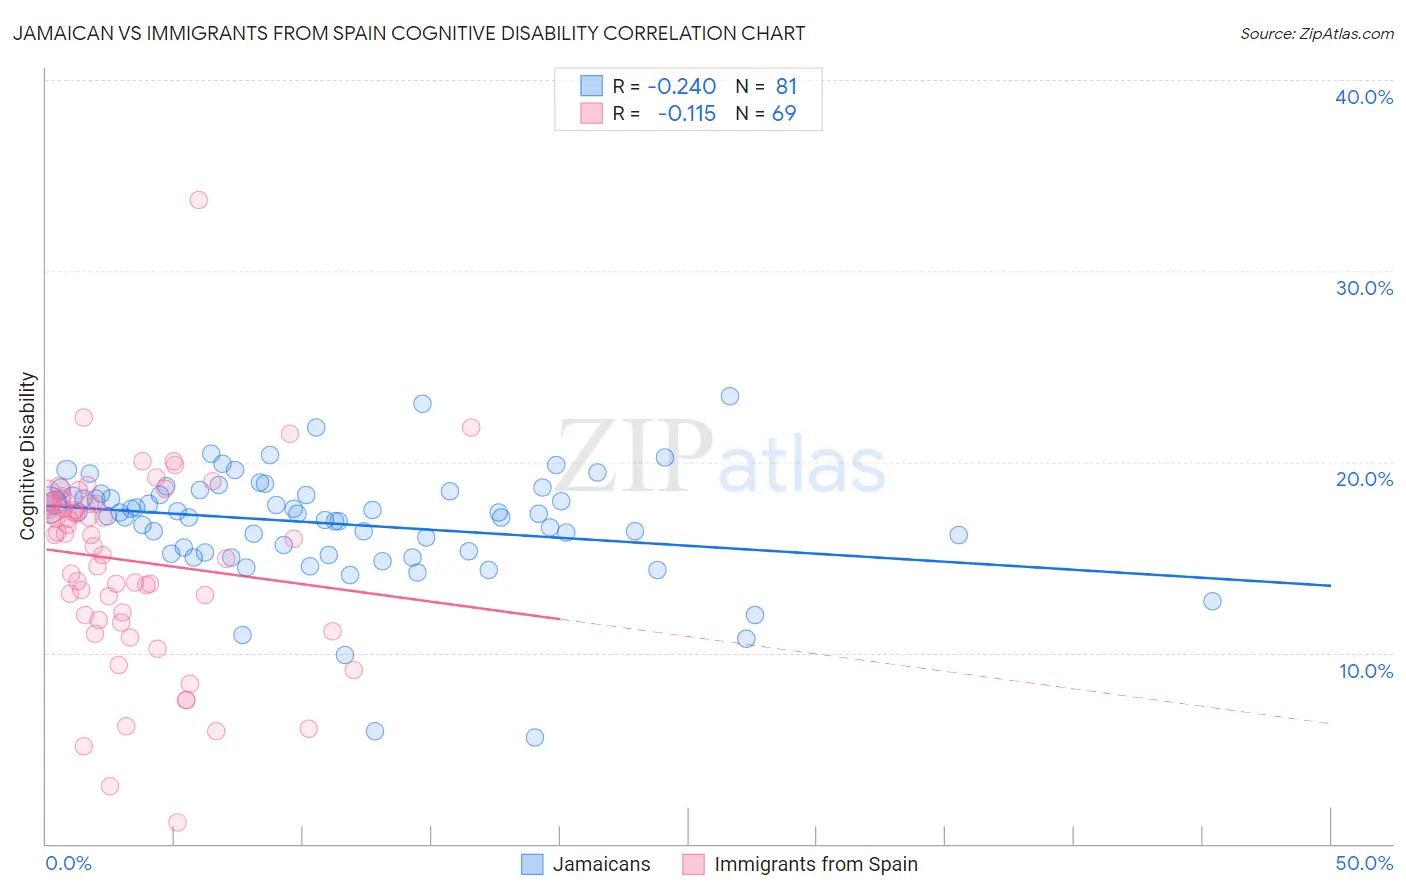
Jamaican vs Immigrants from Spain Cognitive Disability Correlation Chart
The statistical analysis conducted on geographies consisting of 367,984,086 people shows a weak negative correlation between the proportion of Jamaicans and percentage of population with cognitive disability in the United States with a correlation coefficient (R) of -0.240 and weighted average of 17.9%. Similarly, the statistical analysis conducted on geographies consisting of 239,684,126 people shows a poor negative correlation between the proportion of Immigrants from Spain and percentage of population with cognitive disability in the United States with a correlation coefficient (R) of -0.115 and weighted average of 17.4%, a difference of 2.6%.
Cognitive Disability Correlation Summary
| Measurement | Jamaican | Immigrants from Spain |
| Minimum | 5.6% | 1.1% |
| Maximum | 23.5% | 33.7% |
| Range | 17.9% | 32.6% |
| Mean | 16.8% | 14.8% |
| Median | 17.3% | 16.2% |
| Interquartile 25% (IQ1) | 15.3% | 11.9% |
| Interquartile 75% (IQ3) | 18.4% | 17.9% |
| Interquartile Range (IQR) | 3.1% | 6.0% |
| Standard Deviation (Sample) | 3.0% | 5.2% |
| Standard Deviation (Population) | 3.0% | 5.1% |
Similar Demographics by Cognitive Disability
Demographics Similar to Jamaicans by Cognitive Disability
In terms of cognitive disability, the demographic groups most similar to Jamaicans are Immigrants from Bangladesh (17.8%, a difference of 0.040%), Trinidadian and Tobagonian (17.9%, a difference of 0.090%), Paiute (17.8%, a difference of 0.11%), Immigrants from Thailand (17.9%, a difference of 0.12%), and Mexican (17.8%, a difference of 0.13%).
| Demographics | Rating | Rank | Cognitive Disability |
| Immigrants | Mexico | 1.8 /100 | #237 | Tragic 17.8% |
| Cheyenne | 1.7 /100 | #238 | Tragic 17.8% |
| Cajuns | 1.4 /100 | #239 | Tragic 17.8% |
| Iraqis | 1.4 /100 | #240 | Tragic 17.8% |
| Mexicans | 1.1 /100 | #241 | Tragic 17.8% |
| Paiute | 1.1 /100 | #242 | Tragic 17.8% |
| Immigrants | Bangladesh | 1.0 /100 | #243 | Tragic 17.8% |
| Jamaicans | 0.9 /100 | #244 | Tragic 17.9% |
| Trinidadians and Tobagonians | 0.8 /100 | #245 | Tragic 17.9% |
| Immigrants | Thailand | 0.8 /100 | #246 | Tragic 17.9% |
| Samoans | 0.7 /100 | #247 | Tragic 17.9% |
| French American Indians | 0.7 /100 | #248 | Tragic 17.9% |
| Cree | 0.7 /100 | #249 | Tragic 17.9% |
| Immigrants | Ethiopia | 0.7 /100 | #250 | Tragic 17.9% |
| Malaysians | 0.6 /100 | #251 | Tragic 17.9% |
Demographics Similar to Immigrants from Spain by Cognitive Disability
In terms of cognitive disability, the demographic groups most similar to Immigrants from Spain are Nonimmigrants (17.4%, a difference of 0.010%), Immigrants from Haiti (17.4%, a difference of 0.020%), Immigrants from Western Asia (17.4%, a difference of 0.060%), Immigrants from France (17.4%, a difference of 0.070%), and Delaware (17.4%, a difference of 0.070%).
| Demographics | Rating | Rank | Cognitive Disability |
| Spaniards | 40.3 /100 | #183 | Average 17.3% |
| Crow | 39.1 /100 | #184 | Fair 17.3% |
| Afghans | 38.2 /100 | #185 | Fair 17.3% |
| Cambodians | 35.9 /100 | #186 | Fair 17.3% |
| Immigrants | Fiji | 33.7 /100 | #187 | Fair 17.4% |
| Immigrants | France | 29.8 /100 | #188 | Fair 17.4% |
| Immigrants | Western Asia | 29.5 /100 | #189 | Fair 17.4% |
| Immigrants | Spain | 27.7 /100 | #190 | Fair 17.4% |
| Immigrants | Nonimmigrants | 27.4 /100 | #191 | Fair 17.4% |
| Immigrants | Haiti | 27.1 /100 | #192 | Fair 17.4% |
| Delaware | 25.6 /100 | #193 | Fair 17.4% |
| Immigrants | Bosnia and Herzegovina | 22.0 /100 | #194 | Fair 17.4% |
| New Zealanders | 21.1 /100 | #195 | Fair 17.4% |
| Guyanese | 17.5 /100 | #196 | Poor 17.5% |
| Immigrants | Afghanistan | 16.7 /100 | #197 | Poor 17.5% |