Jamaican vs Korean Cognitive Disability
COMPARE
Jamaican
Korean
Cognitive Disability
Cognitive Disability Comparison
Jamaicans
Koreans
17.9%
COGNITIVE DISABILITY
0.9/ 100
METRIC RATING
244th/ 347
METRIC RANK
16.8%
COGNITIVE DISABILITY
97.1/ 100
METRIC RATING
114th/ 347
METRIC RANK
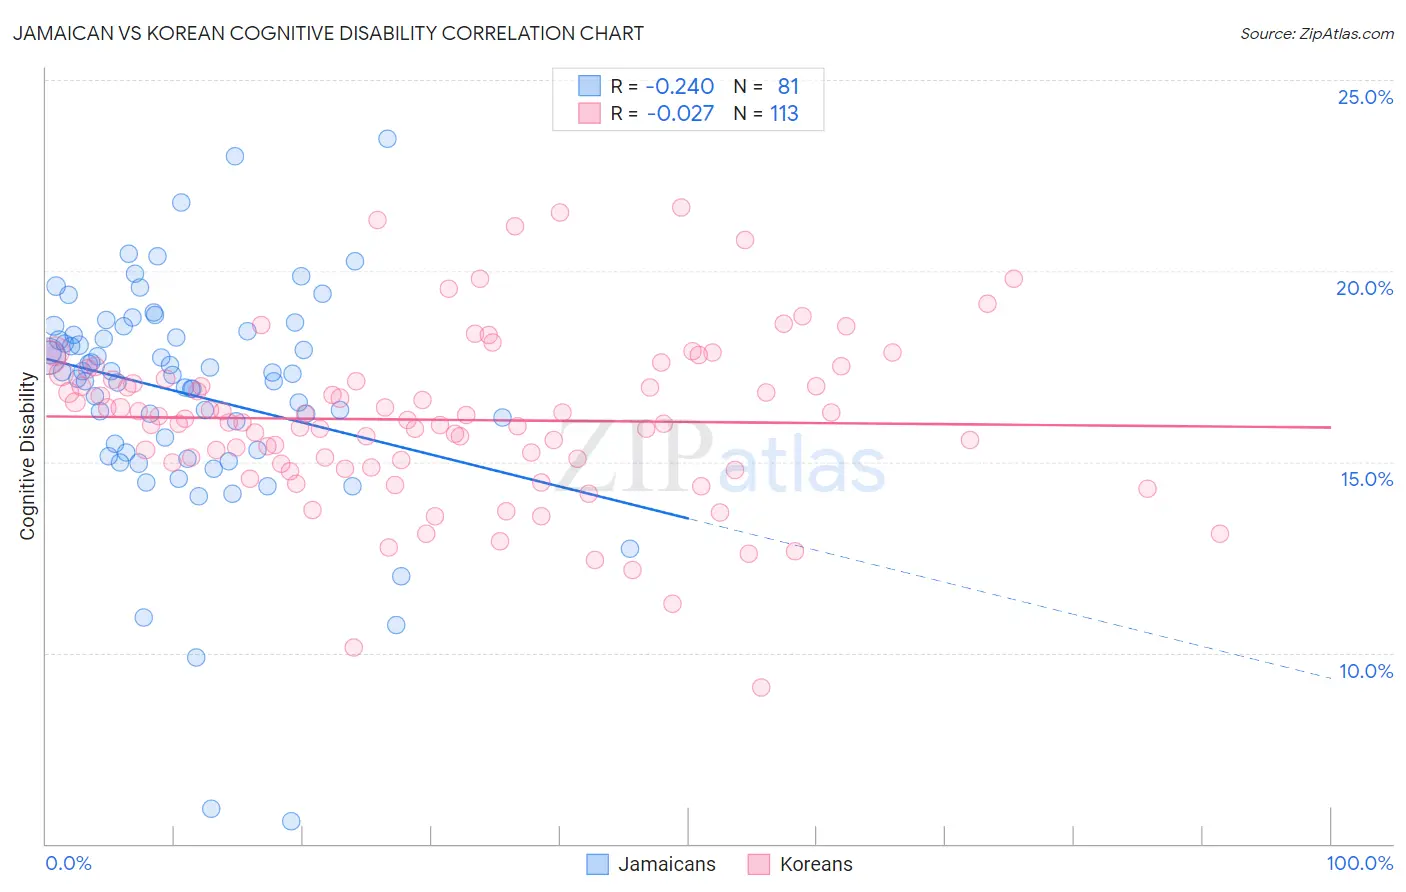
Jamaican vs Korean Cognitive Disability Correlation Chart
The statistical analysis conducted on geographies consisting of 367,984,086 people shows a weak negative correlation between the proportion of Jamaicans and percentage of population with cognitive disability in the United States with a correlation coefficient (R) of -0.240 and weighted average of 17.9%. Similarly, the statistical analysis conducted on geographies consisting of 510,841,440 people shows no correlation between the proportion of Koreans and percentage of population with cognitive disability in the United States with a correlation coefficient (R) of -0.027 and weighted average of 16.8%, a difference of 6.0%.
Cognitive Disability Correlation Summary
| Measurement | Jamaican | Korean |
| Minimum | 5.6% | 9.1% |
| Maximum | 23.5% | 21.7% |
| Range | 17.9% | 12.6% |
| Mean | 16.8% | 16.1% |
| Median | 17.3% | 16.1% |
| Interquartile 25% (IQ1) | 15.3% | 15.0% |
| Interquartile 75% (IQ3) | 18.4% | 17.2% |
| Interquartile Range (IQR) | 3.1% | 2.2% |
| Standard Deviation (Sample) | 3.0% | 2.2% |
| Standard Deviation (Population) | 3.0% | 2.2% |
Similar Demographics by Cognitive Disability
Demographics Similar to Jamaicans by Cognitive Disability
In terms of cognitive disability, the demographic groups most similar to Jamaicans are Immigrants from Bangladesh (17.8%, a difference of 0.040%), Trinidadian and Tobagonian (17.9%, a difference of 0.090%), Paiute (17.8%, a difference of 0.11%), Immigrants from Thailand (17.9%, a difference of 0.12%), and Mexican (17.8%, a difference of 0.13%).
| Demographics | Rating | Rank | Cognitive Disability |
| Immigrants | Mexico | 1.8 /100 | #237 | Tragic 17.8% |
| Cheyenne | 1.7 /100 | #238 | Tragic 17.8% |
| Cajuns | 1.4 /100 | #239 | Tragic 17.8% |
| Iraqis | 1.4 /100 | #240 | Tragic 17.8% |
| Mexicans | 1.1 /100 | #241 | Tragic 17.8% |
| Paiute | 1.1 /100 | #242 | Tragic 17.8% |
| Immigrants | Bangladesh | 1.0 /100 | #243 | Tragic 17.8% |
| Jamaicans | 0.9 /100 | #244 | Tragic 17.9% |
| Trinidadians and Tobagonians | 0.8 /100 | #245 | Tragic 17.9% |
| Immigrants | Thailand | 0.8 /100 | #246 | Tragic 17.9% |
| Samoans | 0.7 /100 | #247 | Tragic 17.9% |
| French American Indians | 0.7 /100 | #248 | Tragic 17.9% |
| Cree | 0.7 /100 | #249 | Tragic 17.9% |
| Immigrants | Ethiopia | 0.7 /100 | #250 | Tragic 17.9% |
| Malaysians | 0.6 /100 | #251 | Tragic 17.9% |
Demographics Similar to Koreans by Cognitive Disability
In terms of cognitive disability, the demographic groups most similar to Koreans are Immigrants from Sri Lanka (16.8%, a difference of 0.0%), Indian (Asian) (16.8%, a difference of 0.010%), Uruguayan (16.8%, a difference of 0.030%), Arapaho (16.8%, a difference of 0.040%), and Albanian (16.8%, a difference of 0.050%).
| Demographics | Rating | Rank | Cognitive Disability |
| Immigrants | Nicaragua | 97.8 /100 | #107 | Exceptional 16.8% |
| Canadians | 97.5 /100 | #108 | Exceptional 16.8% |
| Albanians | 97.3 /100 | #109 | Exceptional 16.8% |
| Arapaho | 97.3 /100 | #110 | Exceptional 16.8% |
| Uruguayans | 97.2 /100 | #111 | Exceptional 16.8% |
| Indians (Asian) | 97.2 /100 | #112 | Exceptional 16.8% |
| Immigrants | Sri Lanka | 97.1 /100 | #113 | Exceptional 16.8% |
| Koreans | 97.1 /100 | #114 | Exceptional 16.8% |
| Yup'ik | 96.9 /100 | #115 | Exceptional 16.9% |
| Inupiat | 96.5 /100 | #116 | Exceptional 16.9% |
| Immigrants | Japan | 96.2 /100 | #117 | Exceptional 16.9% |
| Immigrants | Denmark | 96.2 /100 | #118 | Exceptional 16.9% |
| South Africans | 95.5 /100 | #119 | Exceptional 16.9% |
| Scottish | 95.0 /100 | #120 | Exceptional 16.9% |
| Immigrants | China | 94.9 /100 | #121 | Exceptional 16.9% |