Bermudan vs British West Indian Disability Age Under 5
COMPARE
Bermudan
British West Indian
Disability Age Under 5
Disability Age Under 5 Comparison
Bermudans
British West Indians
1.4%
DISABILITY AGE UNDER 5
1.0/ 100
METRIC RATING
249th/ 347
METRIC RANK
0.99%
DISABILITY AGE UNDER 5
100.0/ 100
METRIC RATING
21st/ 347
METRIC RANK
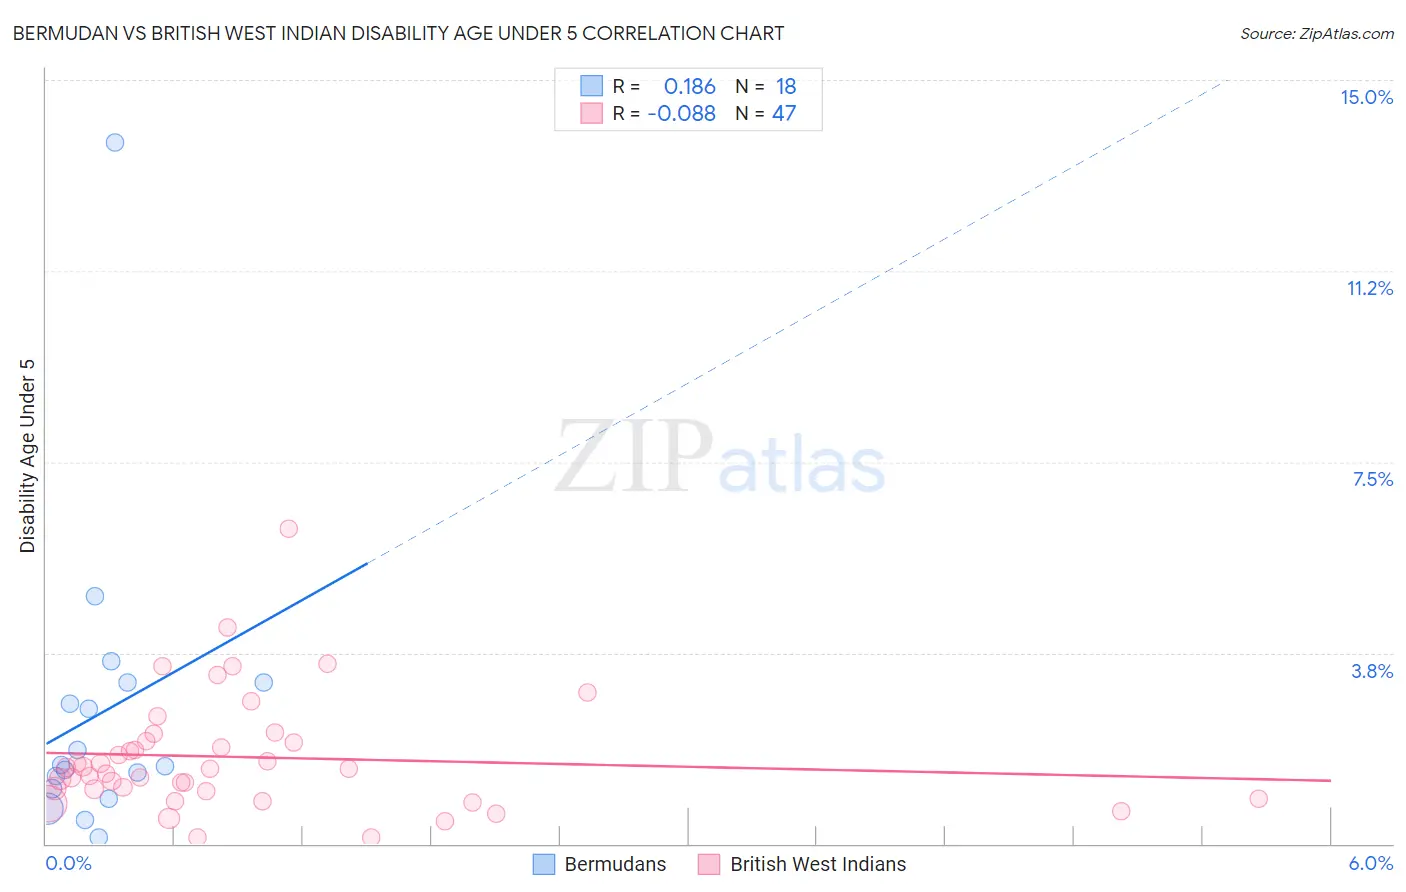
Bermudan vs British West Indian Disability Age Under 5 Correlation Chart
The statistical analysis conducted on geographies consisting of 46,313,673 people shows a poor positive correlation between the proportion of Bermudans and percentage of population with a disability under the age of 5 in the United States with a correlation coefficient (R) of 0.186 and weighted average of 1.4%. Similarly, the statistical analysis conducted on geographies consisting of 105,175,944 people shows a slight negative correlation between the proportion of British West Indians and percentage of population with a disability under the age of 5 in the United States with a correlation coefficient (R) of -0.088 and weighted average of 0.99%, a difference of 38.3%.
Disability Age Under 5 Correlation Summary
| Measurement | Bermudan | British West Indian |
| Minimum | 0.12% | 0.12% |
| Maximum | 13.8% | 6.2% |
| Range | 13.6% | 6.1% |
| Mean | 2.6% | 1.7% |
| Median | 1.5% | 1.5% |
| Interquartile 25% (IQ1) | 1.1% | 1.0% |
| Interquartile 75% (IQ3) | 3.2% | 2.0% |
| Interquartile Range (IQR) | 2.1% | 0.98% |
| Standard Deviation (Sample) | 3.1% | 1.1% |
| Standard Deviation (Population) | 3.0% | 1.1% |
Similar Demographics by Disability Age Under 5
Demographics Similar to Bermudans by Disability Age Under 5
In terms of disability age under 5, the demographic groups most similar to Bermudans are African (1.4%, a difference of 0.010%), Immigrants from Hungary (1.4%, a difference of 0.040%), Eastern European (1.4%, a difference of 0.080%), Immigrants from Scotland (1.4%, a difference of 0.080%), and Immigrants from England (1.4%, a difference of 0.11%).
| Demographics | Rating | Rank | Disability Age Under 5 |
| Lumbee | 2.1 /100 | #242 | Tragic 1.3% |
| Immigrants | Cameroon | 1.7 /100 | #243 | Tragic 1.4% |
| Spaniards | 1.4 /100 | #244 | Tragic 1.4% |
| Potawatomi | 1.1 /100 | #245 | Tragic 1.4% |
| Russians | 1.0 /100 | #246 | Tragic 1.4% |
| Immigrants | England | 1.0 /100 | #247 | Tragic 1.4% |
| Eastern Europeans | 1.0 /100 | #248 | Tragic 1.4% |
| Bermudans | 1.0 /100 | #249 | Tragic 1.4% |
| Africans | 1.0 /100 | #250 | Tragic 1.4% |
| Immigrants | Hungary | 1.0 /100 | #251 | Tragic 1.4% |
| Immigrants | Scotland | 0.9 /100 | #252 | Tragic 1.4% |
| Australians | 0.7 /100 | #253 | Tragic 1.4% |
| Immigrants | Brazil | 0.7 /100 | #254 | Tragic 1.4% |
| Immigrants | Liberia | 0.6 /100 | #255 | Tragic 1.4% |
| Immigrants | Western Europe | 0.5 /100 | #256 | Tragic 1.4% |
Demographics Similar to British West Indians by Disability Age Under 5
In terms of disability age under 5, the demographic groups most similar to British West Indians are Immigrants from Iran (1.00%, a difference of 0.79%), Yakama (1.00%, a difference of 0.87%), Indian (Asian) (1.0%, a difference of 1.1%), Immigrants from Micronesia (1.0%, a difference of 1.5%), and Immigrants from Taiwan (1.0%, a difference of 1.6%).
| Demographics | Rating | Rank | Disability Age Under 5 |
| Yuman | 100.0 /100 | #14 | Exceptional 0.95% |
| Immigrants | Hong Kong | 100.0 /100 | #15 | Exceptional 0.95% |
| Immigrants | Israel | 100.0 /100 | #16 | Exceptional 0.96% |
| Immigrants | China | 100.0 /100 | #17 | Exceptional 0.96% |
| Immigrants | Barbados | 100.0 /100 | #18 | Exceptional 0.97% |
| Puget Sound Salish | 100.0 /100 | #19 | Exceptional 0.97% |
| Nepalese | 100.0 /100 | #20 | Exceptional 0.97% |
| British West Indians | 100.0 /100 | #21 | Exceptional 0.99% |
| Immigrants | Iran | 100.0 /100 | #22 | Exceptional 1.00% |
| Yakama | 100.0 /100 | #23 | Exceptional 1.00% |
| Indians (Asian) | 100.0 /100 | #24 | Exceptional 1.0% |
| Immigrants | Micronesia | 100.0 /100 | #25 | Exceptional 1.0% |
| Immigrants | Taiwan | 100.0 /100 | #26 | Exceptional 1.0% |
| Guyanese | 100.0 /100 | #27 | Exceptional 1.0% |
| Immigrants | Eastern Asia | 100.0 /100 | #28 | Exceptional 1.0% |