Maltese vs Immigrants from Zimbabwe Female Disability
COMPARE
Maltese
Immigrants from Zimbabwe
Female Disability
Female Disability Comparison
Maltese
Immigrants from Zimbabwe
12.2%
FEMALE DISABILITY
57.0/ 100
METRIC RATING
170th/ 347
METRIC RANK
11.6%
FEMALE DISABILITY
99.5/ 100
METRIC RATING
91st/ 347
METRIC RANK
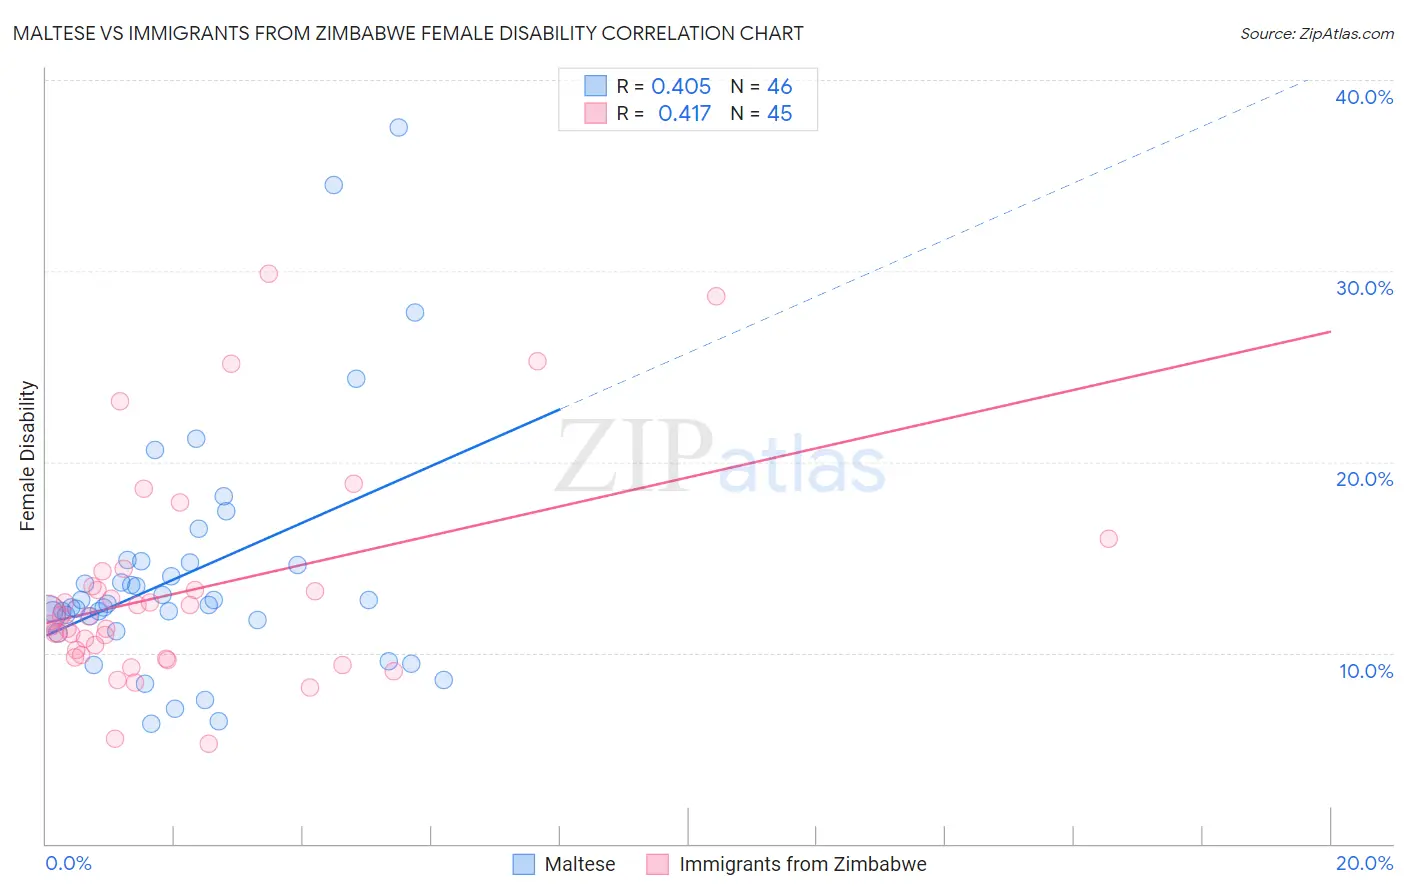
Maltese vs Immigrants from Zimbabwe Female Disability Correlation Chart
The statistical analysis conducted on geographies consisting of 126,465,818 people shows a moderate positive correlation between the proportion of Maltese and percentage of females with a disability in the United States with a correlation coefficient (R) of 0.405 and weighted average of 12.2%. Similarly, the statistical analysis conducted on geographies consisting of 117,810,271 people shows a moderate positive correlation between the proportion of Immigrants from Zimbabwe and percentage of females with a disability in the United States with a correlation coefficient (R) of 0.417 and weighted average of 11.6%, a difference of 4.9%.
Female Disability Correlation Summary
| Measurement | Maltese | Immigrants from Zimbabwe |
| Minimum | 6.3% | 5.2% |
| Maximum | 37.5% | 29.8% |
| Range | 31.2% | 24.6% |
| Mean | 14.1% | 13.2% |
| Median | 12.5% | 11.9% |
| Interquartile 25% (IQ1) | 11.7% | 9.8% |
| Interquartile 75% (IQ3) | 14.7% | 13.9% |
| Interquartile Range (IQR) | 3.0% | 4.0% |
| Standard Deviation (Sample) | 6.3% | 5.5% |
| Standard Deviation (Population) | 6.3% | 5.5% |
Similar Demographics by Female Disability
Demographics Similar to Maltese by Female Disability
In terms of female disability, the demographic groups most similar to Maltese are Immigrants from Southern Europe (12.2%, a difference of 0.030%), Lebanese (12.2%, a difference of 0.040%), Immigrants from Haiti (12.2%, a difference of 0.070%), Immigrants from Latin America (12.2%, a difference of 0.080%), and Lithuanian (12.2%, a difference of 0.10%).
| Demographics | Rating | Rank | Female Disability |
| Guatemalans | 63.8 /100 | #163 | Good 12.1% |
| Czechs | 63.6 /100 | #164 | Good 12.1% |
| Immigrants | Oceania | 61.8 /100 | #165 | Good 12.1% |
| Lithuanians | 59.5 /100 | #166 | Average 12.2% |
| Immigrants | Latin America | 59.0 /100 | #167 | Average 12.2% |
| Immigrants | Haiti | 58.8 /100 | #168 | Average 12.2% |
| Lebanese | 58.1 /100 | #169 | Average 12.2% |
| Maltese | 57.0 /100 | #170 | Average 12.2% |
| Immigrants | Southern Europe | 56.3 /100 | #171 | Average 12.2% |
| Haitians | 51.9 /100 | #172 | Average 12.2% |
| Immigrants | Mexico | 50.8 /100 | #173 | Average 12.2% |
| Immigrants | England | 50.0 /100 | #174 | Average 12.2% |
| Immigrants | St. Vincent and the Grenadines | 49.7 /100 | #175 | Average 12.2% |
| Immigrants | Guyana | 43.1 /100 | #176 | Average 12.2% |
| Immigrants | Ghana | 42.5 /100 | #177 | Average 12.2% |
Demographics Similar to Immigrants from Zimbabwe by Female Disability
In terms of female disability, the demographic groups most similar to Immigrants from Zimbabwe are Vietnamese (11.6%, a difference of 0.010%), Immigrants from Romania (11.6%, a difference of 0.010%), Immigrants from Czechoslovakia (11.6%, a difference of 0.010%), Immigrants from Denmark (11.6%, a difference of 0.11%), and Yup'ik (11.6%, a difference of 0.11%).
| Demographics | Rating | Rank | Female Disability |
| Immigrants | Poland | 99.6 /100 | #84 | Exceptional 11.6% |
| Palestinians | 99.6 /100 | #85 | Exceptional 11.6% |
| Immigrants | Cameroon | 99.6 /100 | #86 | Exceptional 11.6% |
| Immigrants | Denmark | 99.5 /100 | #87 | Exceptional 11.6% |
| Yup'ik | 99.5 /100 | #88 | Exceptional 11.6% |
| Vietnamese | 99.5 /100 | #89 | Exceptional 11.6% |
| Immigrants | Romania | 99.5 /100 | #90 | Exceptional 11.6% |
| Immigrants | Zimbabwe | 99.5 /100 | #91 | Exceptional 11.6% |
| Immigrants | Czechoslovakia | 99.5 /100 | #92 | Exceptional 11.6% |
| Immigrants | Sierra Leone | 99.4 /100 | #93 | Exceptional 11.6% |
| Immigrants | Brazil | 99.4 /100 | #94 | Exceptional 11.6% |
| Immigrants | Northern Europe | 99.4 /100 | #95 | Exceptional 11.6% |
| Immigrants | Russia | 99.0 /100 | #96 | Exceptional 11.7% |
| Koreans | 99.0 /100 | #97 | Exceptional 11.7% |
| Uruguayans | 98.8 /100 | #98 | Exceptional 11.7% |